Euro/U.S. Dollar (EURUSD) Elliott Wave Analysis - Trading Lounge Day Chart
EURUSD Elliott Wave Technical Analysis
Function: Bullish Trend
Mode: Impulsive
Structure: Orange Wave 1
Position: Navy Blue Wave 1
Direction (Next Lower Degrees): Orange Wave 2
Wave Cancel Invalidation Level: 1.02197
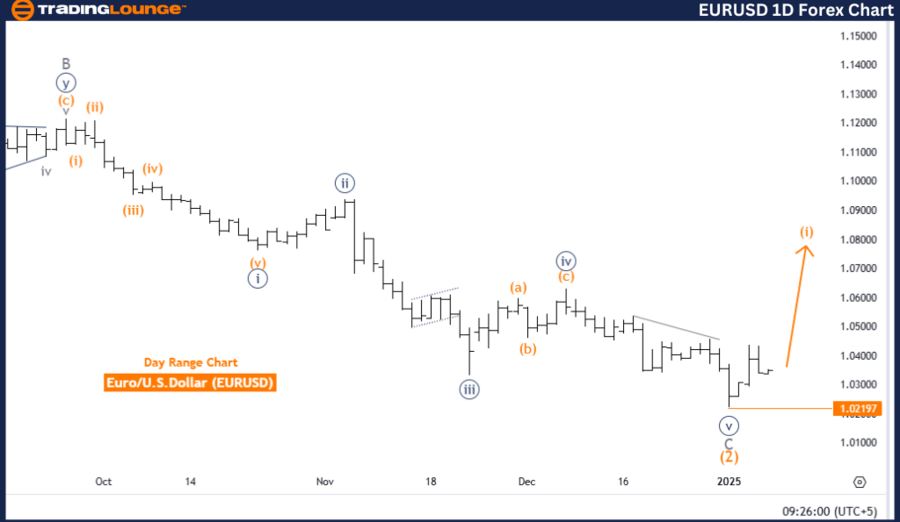
The Euro to U.S. Dollar (EURUSD) currency pair is in a bullish trend on the daily chart, as per Elliott Wave Theory. Currently, the market is progressing through an impulsive phase represented by orange wave 1, which is part of the larger navy blue wave 1. This stage marks the initial upward move in a broader bullish cycle, with orange wave 1 actively unfolding.
After the completion of orange wave 1, the next expected phase is orange wave 2, a corrective wave. This alternation between impulsive and corrective phases follows the core principles of Elliott Wave Theory.
An invalidation level at 1.02197 is critical. If the price dips below this level, the current wave structure will no longer be valid, prompting a reevaluation. This threshold is essential for confirming or rejecting the ongoing wave count and aligning future analysis.
Summary
- The EURUSD pair is in the early stages of a bullish trend, with orange wave 1 forming within the broader navy blue wave 1.
- This phase demonstrates strong upward momentum in the market's overall structure.
- Orange wave 2 is expected to introduce a temporary corrective phase before the continuation of the bullish trend.
- The invalidation level (1.02197) acts as a pivotal reference for confirming the analysis and monitoring future price action.

Euro/U.S. Dollar (EURUSD) Elliott Wave Analysis - Trading Lounge 4-Hour Chart
EURUSD Elliott Wave Technical Analysis
Function: Counter-Trend
Mode: Corrective
Structure: Gray Wave 2
Position: Orange Wave 1
Direction (Next Higher Degrees): Gray Wave 3
Wave Cancel Invalidation Level: 1.02197
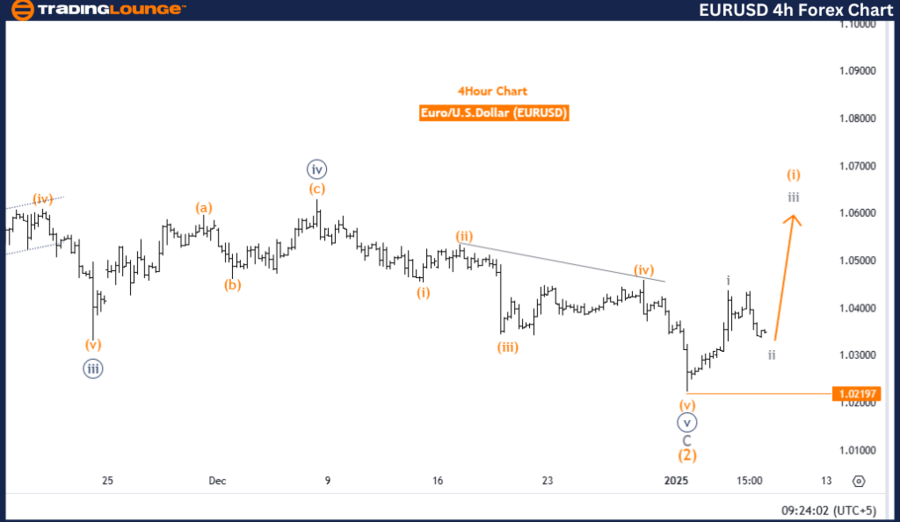
On the 4-hour chart, EURUSD is undergoing a counter-trend corrective phase, as identified through Elliott Wave Analysis. This phase corresponds to the formation of gray wave 2, which follows the completion of gray wave 1 within the broader wave framework. The current activity signals a retracement in the ongoing trend, with gray wave 2 actively unfolding.
The corrective nature of gray wave 2 represents a temporary pullback before the anticipated development of gray wave 3, which will continue the broader upward trend. This alternation between impulsive and corrective waves aligns with Elliott Wave principles, helping to shape the overall market trajectory.
The invalidation level is set at 1.02197. If the price falls below this threshold, the current wave count becomes invalid, requiring a reassessment of the analysis. This level is a critical benchmark for confirming the current wave structure and adjusting expectations accordingly.
Summary
- EURUSD is in a corrective phase defined by gray wave 2, following the completion of gray wave 1.
- This phase reflects a temporary market adjustment within the larger bullish trend, with gray wave 3 expected to resume the upward momentum.
- The invalidation level (1.02197) is a key point of reference for validating the current wave scenario and preparing for future price developments.
- The analysis underscores short-term corrective adjustments while maintaining the outlook of a broader bullish trend.
Technical Analyst: Malik Awais
Source: visit Tradinglounge.com and learn From the Experts Join TradingLounge Here
Previous: AUDJPY Elliott Wave Technical Analysis
VALUE Offer - Buy 1 Month & Get 3 Months!Click here
Access 7 Analysts Over 200 Markets Covered. Chat Room With Support
