27Mar

The TJX Companies Inc. Elliott Wave Technical Analysis for TJX Stock Shows Price Target at $130, and Strong Upside Momentum Ahead

TJX Elliott Wave Analysis – TradingLounge Daily Chart

The TJX Companies Inc. (NYSE: TJX)

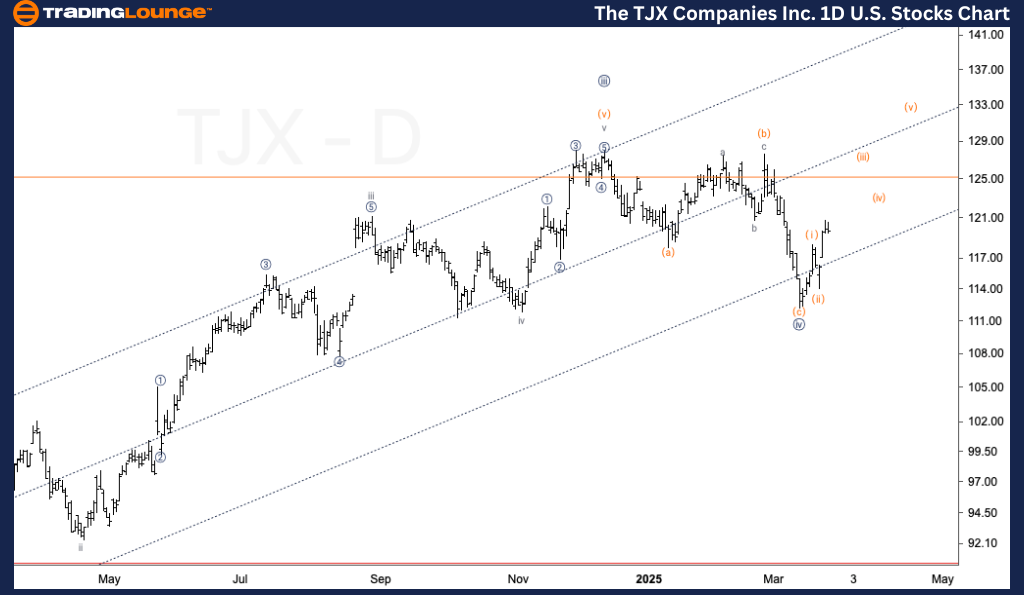
TJX Elliott Wave Technical Analysis

Function: Trend

Mode: Impulsive

Structure: Motive

Position: Wave {v} of 3

Direction: Upward movement into wave {v}

Details: A probable low in Minute wave {iv} appears to have formed slightly above the $110 level. The price action has resumed its upward trajectory, pointing to the likely initiation of wave {v} of 3. A sustained rally would further confirm the bullish Elliott Wave count and continuation of the uptrend.

The-TJX-Companies-In...


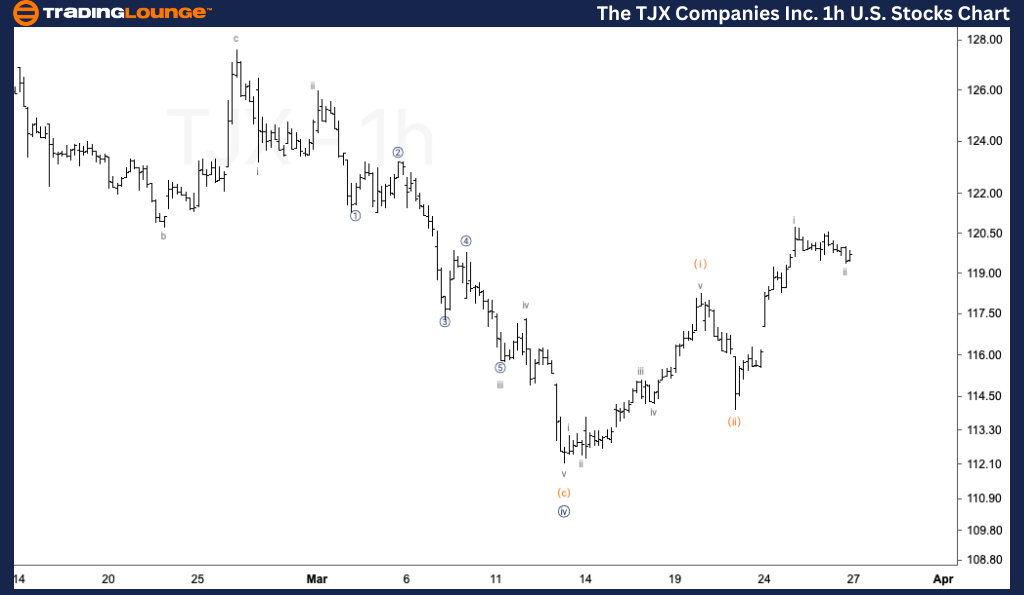
TJX Elliott Wave Analysis – TradingLounge 1-Hour Chart

The TJX Companies Inc. (NYSE: TJX)

Function: Trend

Mode: Impulsive

Structure: Motive

Position: Wave (iii) of {v}

Direction: Upside continuation into wave (iii)

Details: Current price action suggests a wave ii pullback within wave (iii) of {v}, setting the stage for a potential strong upward push in wave (iii). The target zone for this next move is around $130, marking the anticipated completion of Minor degree wave MG1.

Technical Analyst: Alessio Barretta

Source: Visit Tradinglounge.com and learn from the Experts. Join TradingLounge Here 

Previous: Caterpillar Inc. (CAT) Elliott Wave Technical Analysis

VALUE Offer - Buy 1 Month & Get 3 Months!Click here

Access 7 Analysts Over 200 Markets Covered. Chat Room With Support

The-TJX-Companies-In...


The TJX Companies Inc. (TJX) – Elliott Wave Market Outlook

Elliott Wave analysis of TJX (The TJX Companies Inc.) indicates a bullish structure developing on both the daily and 1-hour charts. On the daily timeframe, Minute wave {iv} seems to have bottomed just above $110, with recent price behavior supporting the start of wave {v} of 3. This aligns with expectations of continued upward momentum.

The 1-hour chart shows a wave ii retracement inside wave (iii) of {v}, implying a likely surge toward the $130 price level. Both charts highlight an impulsive wave formation, supporting a bullish trend in the near to mid-term.

Outlook: The bullish scenario remains intact if the current Elliott Wave count holds. Key price zones include support near $110 and resistance near $130, which will be crucial for validating the next move higher.

Related

S&P 500 Index Elliott Wave Technical Analysis: Predict Market Trends and Optimize Your Trading Strategy

S&P 500 Index Elliott Wave Technical Analysis: Predict Market Trends and Optimize Your Trading Strategy

This detailed analysis of the S&P 500 through Elliott Wave theory provides insights into the current...

Read More >
In-Depth Analysis breaks down the Uniswap Crypto UNIUSD Elliott Wave Technical Analysis and Price Movements

In-Depth Analysis breaks down the Uniswap Crypto UNIUSD Elliott Wave Technical Analysis and Price Movements

This article provides an in-depth Elliott Wave Uniswap (UNIUSD) analysis, focusing on the latest pri...

Read More >
Euro/British Pound (EURGBP) Forex Elliott Wave Technical Analysis: Forecast, Bearish Trends, and Key Levels Explained

Euro/British Pound (EURGBP) Forex Elliott Wave Technical Analysis: Forecast, Bearish Trends, and Key Levels Explained

This comprehensive EURGBP Elliott Wave analysis provides insights into the ongoing bearish trend, ke...

Read More >
U.S. Dollar/Swiss Franc (USDCHF) Forex Elliott Wave Technical Analysis for both day and 4-hour charts

U.S. Dollar/Swiss Franc (USDCHF) Forex Elliott Wave Technical Analysis for both day and 4-hour charts

This article provides an in-depth USDCHF Elliott Wave analysis for both day and 4-hour charts. It co...

Read More >
GBPUSD Elliott Wave Analysis: Current Trends, Bullish Transition, Invalidation Levels, and Actionable Trading Insights

GBPUSD Elliott Wave Analysis: Current Trends, Bullish Transition, Invalidation Levels, and Actionable Trading Insights

GBPUSD using Elliott Wave principles, featuring insights into current wave structures, invalidation ...

Read More >
VeChain Crypto Price News Today - Elliott Wave Technical Analysis

VeChain Crypto Price News Today - Elliott Wave Technical Analysis

Elliott Wave analysis for VeChain/USD (VETUSD), offering valuable trading strategies, price forecast...

Read More >

Buy 1 Month

Get 3 Months!

Special Offer:

Trade Recommendations

Unleash the power of deversified trading with our comprehensive portfolio, covering:

  • Stock Trades
  • Crypto Trades
  • Forex Trades
  • Commodity Trades
Elliott Wave Analysis

Gain a competive edge with expert insights in to:

  • Global Indices
  • US Stocks & ASX Stocks
  • Forex & Crypto
  • Commodities
Top-Notch Trading Tools

Equip yourself with the tools of success:

  • Social Chat
  • Elliott Wave Algorithm
  • Screener
  • TradingLevels
  • Trading Game
7 Elliott Wave Analysts

Stay ahead of the market with daily charts and insightful videos
-Your secret to strategic trading!

JOIN HERE


Welcome to TradingLounge (ASIC A.R.No. 321187), specialists in trades, trading education and technical analysis, covering stocks, indices, commodities, forex and cryptocurrencies.

When you join TradingLounge you have access to everything we offer, including trade tools, educational content and a social platform to chat with like-minded investors.

Read more

@Copyright 2024 by tradinglounge.com

Contact Us

Australian no: 02 4787 6020

International no: +61 (2) 47876020

Pay with:

Find us on