KOSPI Composite Elliott Wave Analysis Trading Lounge Day Chart,
KOSPI Composite Elliott Wave Technical Analysis
FUNCTION: Trend
MODE: impulsive
STRUCTURE: gray wave 3
POSITION: Orange Wave 3
DIRECTION NEXT LOWER DEGREES: gray wave 4
DETAILS: gray wave 2 looking completed.
Now gray wave 3 of 3 is in play.
Wave Cancel invalid level: 2552.92
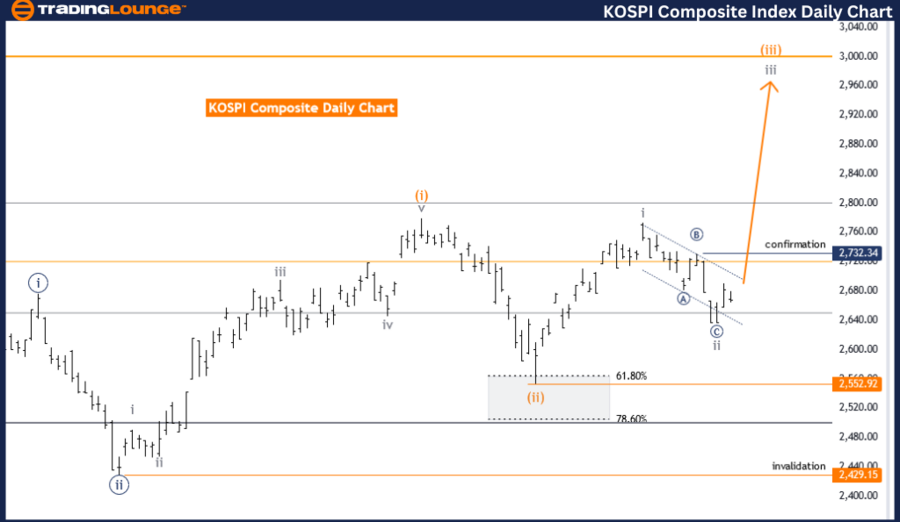
The KOSPI Composite Elliott Wave Analysis for the day chart offers a comprehensive view of the current market trends based on Elliott Wave Theory. The analysis identifies the function of the market movement as a trend, suggesting that the current market direction is in line with the primary trend rather than a correction or counter-trend.
The mode of the wave structure is impulsive, which means the market is experiencing strong, directional movements typical of an Elliott Wave impulsive sequence. This implies a continuation of the primary trend with significant price changes in the direction of the trend.
The specific wave structure under examination is gray wave 3, which is part of a larger orange wave 3. The current position within this wave structure indicates that gray wave 2 is considered complete, and now the market is moving into gray wave 3 of orange wave 3. This phase is crucial as it typically represents a powerful and extended move within the Elliott Wave sequence.
The direction for the next lower degrees is identified as gray wave 4, which will follow the completion of the current impulsive wave. This suggests that after the completion of gray wave 3, the market will likely enter a corrective phase before resuming the primary trend.
The details of the analysis highlight that gray wave 2 has likely completed, marking the end of a corrective phase and the beginning of gray wave 3 of 3. This phase is expected to exhibit strong impulsive characteristics, driving the market further in the direction of the primary trend. The wave cancel invalid level is set at 2552.92, indicating that if the market falls below this level, the current wave count would be invalidated and require reassessment.
In summary, the KOSPI Composite Elliott Wave Analysis on the day chart describes an impulsive market mode within a trending function, focusing on the completion of gray wave 2 and the initiation of gray wave 3 of 3. This suggests a continuation of the strong upward movement in the market, with a subsequent corrective phase anticipated in gray wave 4. The analysis provides critical insights for traders, indicating robust market activity aligned with the primary trend.

KOSPI Composite Elliott Wave Analysis Trading Lounge Weekly Chart,
KOSPI Composite Elliott Wave Technical Analysis
FUNCTION: Trend
MODE: impulsive
STRUCTURE: orange wave 3
POSITION: Navy Blue Wave 3
DIRECTION NEXT LOWER DEGREES: orange wave 4
DETAILS: Orange Wave 2 looking completed.
Now orange wave 3 of 3 is in play.
Wave Cancel invalid level: 2429.15
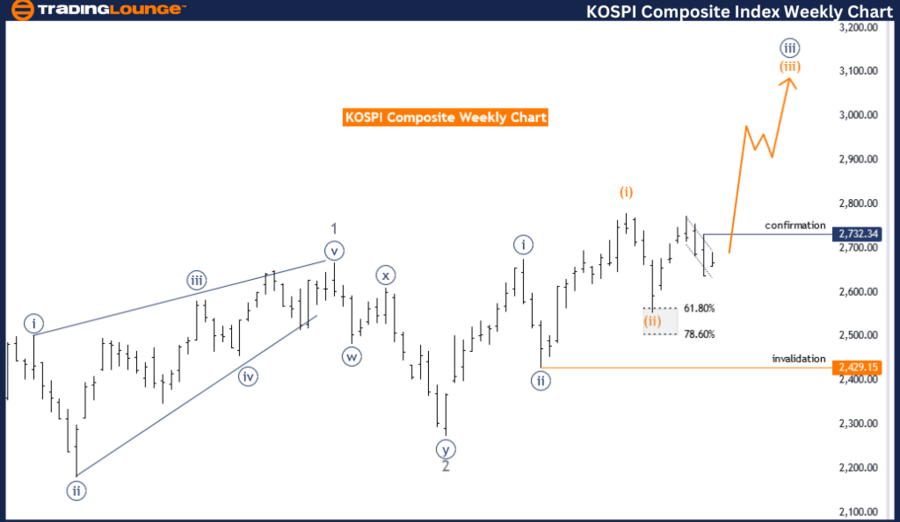
The KOSPI Composite Elliott Wave Analysis for the weekly chart focuses on the market's primary trend using Elliott Wave Theory. The analysis categorizes the market function as a trend, indicating the movement aligns with the overall direction of the market rather than acting as a correction or counter-movement.
The mode of the current wave structure is impulsive, signifying strong, directional price movements that are characteristic of an Elliott Wave impulsive pattern. This mode suggests a continuation of the prevailing market trend with substantial price advances in the direction of this trend.
The wave structure being analyzed is orange wave 3, which is a segment of a broader navy blue wave 3. The market is currently positioned within this structure, indicating that orange wave 2 is considered complete. The market is now advancing into orange wave 3 of 3, a critical phase typically marked by vigorous and extended movements in the direction of the primary trend.
The next lower degrees are expected to move into orange wave 4 following the completion of the current impulsive wave. This transition suggests that after orange wave 3 concludes, the market will likely experience a corrective phase before continuing the primary trend.
The details emphasize that orange wave 2 appears to be complete, indicating the end of a corrective period and the start of orange wave 3 of 3. This phase is expected to show strong impulsive characteristics, driving the market further in its primary direction. The wave cancel invalid level is set at 2429.15, meaning if the market falls below this level, the current wave count would be invalidated and necessitate a reassessment of the wave structure.
In summary, the KOSPI Composite Elliott Wave Analysis for the weekly chart describes an impulsive market mode within a trending function, focusing on the completion of orange wave 2 and the beginning of orange wave 3 of 3. This indicates a continuation of significant upward movement in the market, with a corrective phase anticipated in orange wave 4. The analysis provides essential insights for traders, highlighting robust market activity in alignment with the primary trend.
Technical Analyst: Malik Awais
Source: visit Tradinglounge.com and learn From the Experts Join TradingLounge Here
See previous: DOW JONES - DJI Elliott Wave Technical Analysis
Special Trial Offer - 0.76 Cents a Day for 3 Months! Click here
Access 7 Analysts Over 170 Markets Covered. Chat Room With Support
