Visa Inc. (V) Elliott Wave Analysis – Trading Lounge Daily Chart
V Elliott Wave Technical Analysis
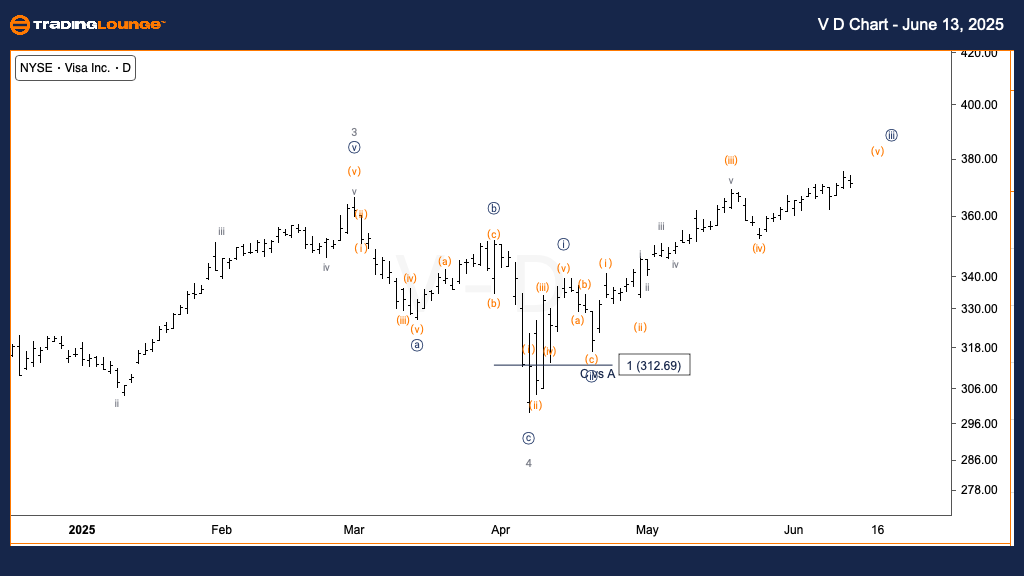
FUNCTION: Trend
MODE: Impulsive
STRUCTURE: Motive
POSITION: Wave {iii} of 5
DIRECTION: Uptrend in wave {iii}
DETAILS: Approaching projected resistance near $380 (MinorGroup2); sideways correction as wave {iv} may follow
Visa Inc. (NYSE: V) continues to show a robust uptrend on the daily timeframe, currently tracking wave {iii} of the larger primary wave 5 sequence. Market momentum is driving price action towards the $380 resistance zone, which aligns with the peak of MinorGroup2. This level could serve as a short-term ceiling, triggering a temporary consolidation phase or correction wave {iv} before the upward structure resumes.
Visa Inc. (V) Elliott Wave Analysis – Trading Lounge 1-Hour Chart
V Elliott Wave Technical Analysis
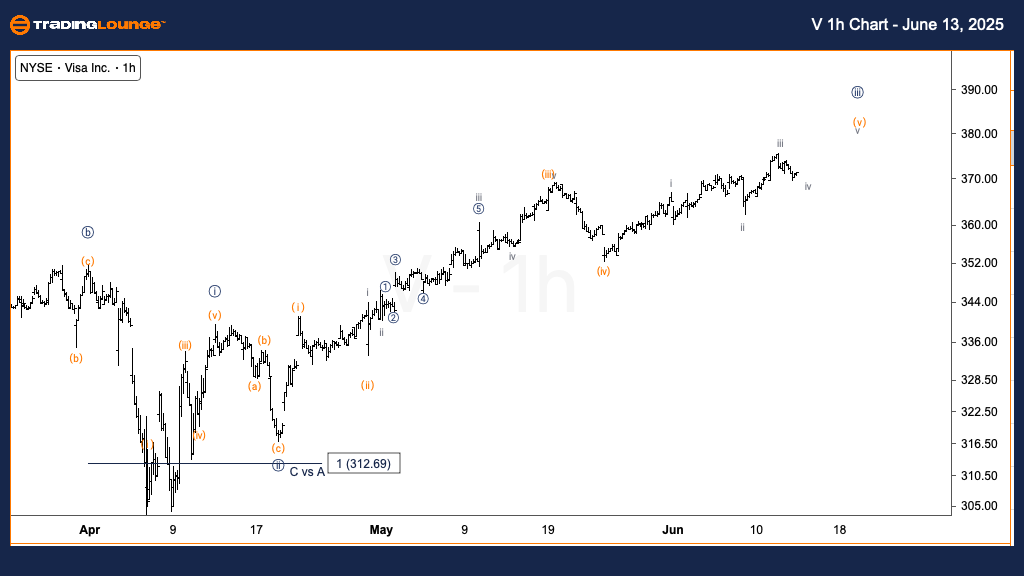
FUNCTION: Trend
MODE: Impulsive
STRUCTURE: Motive
POSITION: Wave iii of (v)
DIRECTION: Continued uptrend in wave v
DETAILS: Currently unfolding wave iv, potential setup for final advance in wave (v)
The 1-hour chart for Visa indicates the development of wave iv within the fifth wave (v), signaling a potential breakout ahead. This intraday corrective move aligns with the broader bullish outlook, suggesting a final push towards the $380 level to complete wave (v). This projection supports the daily wave {iii} structure, reinforcing a likely near-term high.
Technical Analyst: Alessio Barretta
Source: Visit Tradinglounge.com and learn from the Experts. Join TradingLounge Here
Previous: CSX Corp. (CSX) Elliott Wave Technical Analysis
VALUE Offer - $1 for 2 Weeks then $29 a month!Click here
Access 7 Analysts Over 200 Markets Covered. Chat Room With Support
Summary
Visa Inc. (NYSE: V) is displaying a consistent impulsive wave pattern on both daily and intraday charts. The current formation points toward an imminent short-term peak, with the potential for wave {iv} consolidation prior to continued upside. Technical traders should monitor price action closely for signs of the wave {iv} pullback and the completion of wave (v) as the $380 resistance level approaches.