The GX Uranium ETF is an exchange-traded fund (ETF) that focuses on investing in companies involved in the uranium industry. Uranium is a key component in nuclear power generation, and its demand is influenced by factors such as global energy needs, environmental concerns, and government policies regarding nuclear power.

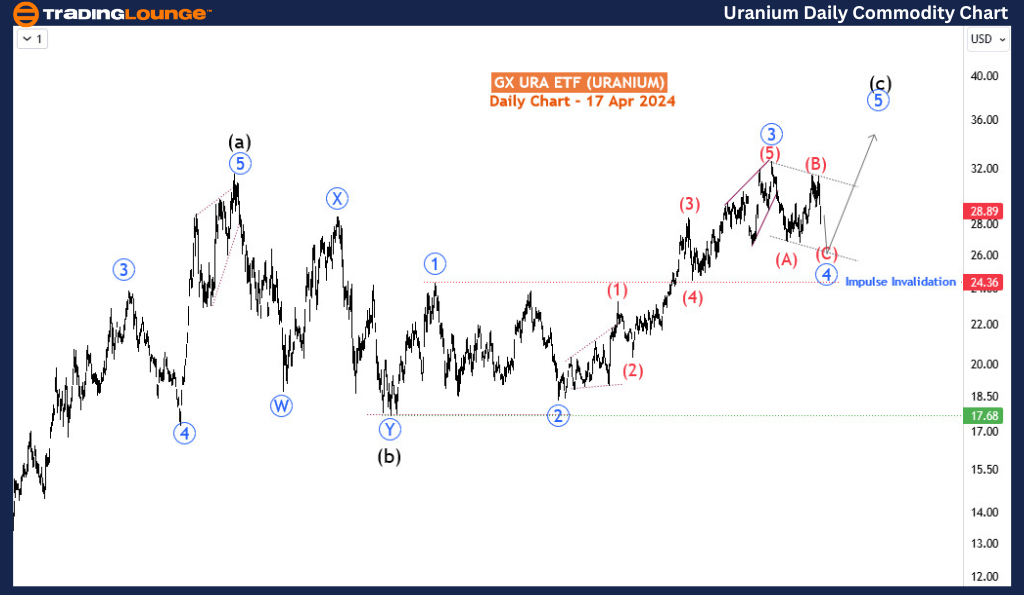
GX Uranium ETF Elliott Wave Analysis Trading Lounge Daily Chart

GX Uranium ETF (URA) Elliott Wave Analysis 
Function - Counter trend
Mode - Corrective
Structure - Emerging Zigzag
Position - Red wave (C) of blue 4 
Direction - Red wave (C) of blue 4 is still in play
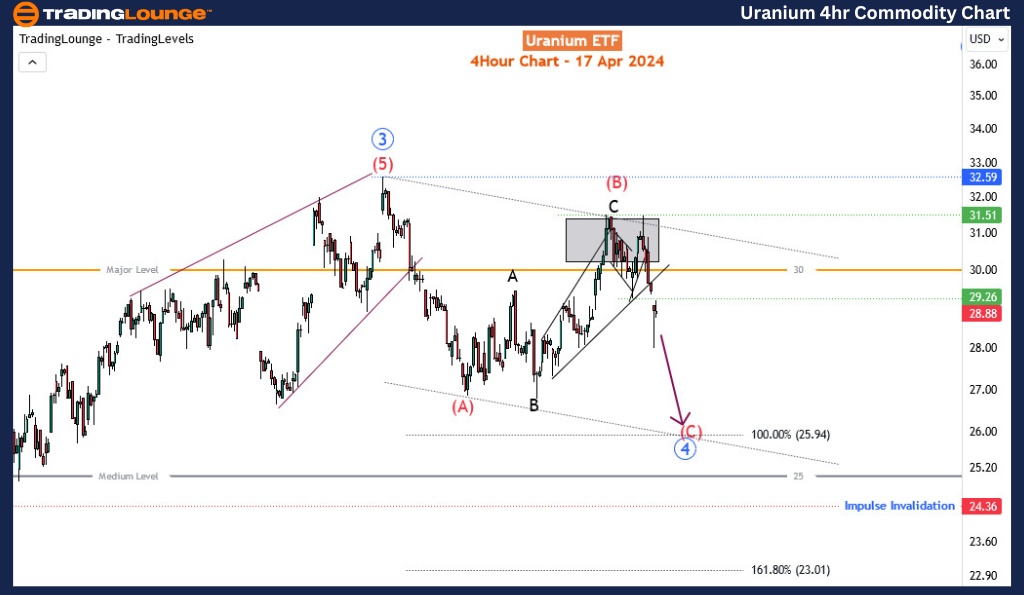
Details - Price broke blow 30. Wave (C) was confirmed by the break below 29.26. Should extend toward 25.94.

Recent market movements have seen the GX Uranium ETF undergo a bearish correction, with a decline exceeding 5% over the current trading week. This downturn commenced on February 1st, 2023, and is anticipated to persist in the short term before encountering a support level, heralding the onset of renewed upward momentum. Notably, this correction unfolds within the broader context of a bullish trend that commenced in March 2022. Despite enduring an over 8-month pullback between November 2021 and July 2022, the ETF has steadily ascended, reaching its loftiest valuation since April 2014. Consequently, post the prevailing retracement, a resumption of the bullish trajectory is anticipated.

Analyzing the daily time frame reveals a discernible bullish impulse of the cycle degree (marked in blue) after the supercycle wave (b). The termination of the 3rd wave - designated as blue wave 3 - occurred in February 2023, characterized by a diagonal pattern, followed by the onset of the corresponding 4th wave. This 4th wave manifests as a zigzag pattern, navigating through wave (C) after completing wave (B) via an expanding diagonal. To maintain the integrity of the overall impulse structure, the 4th wave - delineated as blue wave 4 - must remain above the critical level of 24.36. Expectations converge on buyers eagerly awaiting the conclusion of wave (C) to propel the bullish momentum into the 5th wave.
Uranium-daily-commod...


GX Uranium ETF Elliott Wave Analysis Trading Lounge 4Hr Chart

GX Uranium ETF 4-Hour Chart Analysis:

Examining the H4 chart illuminates the sub-waves of (A)-(B)-(C) and the emergence of wave (C). The initial target for wave (C) aligns with the 100% extension of wave (A) at 25.94, slightly above the psychological barrier of 25. Traders are thus advised to anticipate the culmination of wave (C) within the 25.94-25 zone, paving the way for subsequent rallies.

Technical Analyst: Sanmi Adeagbo

Source: visit Tradinglounge.com and learn From the Experts Join TradingLounge Here 

See Previous: Silver (XAGUSD) Commodity

TradingLounge Once Off SPECIAL DEAL: Here > 1 month Get 3 months

TradingLounge's Free Week Extravaganza!

April 14 – 21: Unlock the Doors to Trading Excellence — Absolutely FREE
Uranium-4Hr-commodit...

Related

Axis Bank Ltd Stocks Analysis – AXISBANK Elliott Wave Technical Analysis to make informed Decisions about Bank shares

Axis Bank Ltd Stocks Analysis – AXISBANK Elliott Wave Technical Analysis to make informed Decisions about Bank shares

This article provides a detailed analysis of Axis Bank's stock using Elliott Wave theory and tec...

Read More >
Unlocking ASX Trading Success: REECE LIMITED - REH Stock Analysis & Elliott Wave Technical Forecast

Unlocking ASX Trading Success: REECE LIMITED - REH Stock Analysis & Elliott Wave Technical Forecast

This article provides an in-depth Elliott Wave technical analysis of Reece Limited (ASX: REH), offer...

Read More >
Pepsico Inc. (PEP) Elliott Wave Technical Analysis Shows Bearish Wave (C) Structure Targeting $100 With Impulse Completion

Pepsico Inc. (PEP) Elliott Wave Technical Analysis Shows Bearish Wave (C) Structure Targeting $100 With Impulse Completion

Pepsico (PEP) shows a bearish technical setup according to Elliott Wave theory. Wave (C) of 4 is act...

Read More >
Bitcoin/ U.S. Dollar (BTCUSD) Elliott Wave Analysis: Support & Resistance Levels, and Crypto Market Trends for Traders

Bitcoin/ U.S. Dollar (BTCUSD) Elliott Wave Analysis: Support & Resistance Levels, and Crypto Market Trends for Traders

Elliott Wave analysis for BTCUSD, covering the current Bitcoin wave structure, key support and resis...

Read More >
In-Depth Elliott Wave Technical Analysis for McDonald’s Corp. (MCD) Stocks: Price Trends, Forecasts, and Key Insights

In-Depth Elliott Wave Technical Analysis for McDonald’s Corp. (MCD) Stocks: Price Trends, Forecasts, and Key Insights

This Elliott Wave analysis of McDonald's (MCD) stock examines both daily and 1-hour charts to pr...

Read More >

$1 for 2 Weeks

then $29 a month!

What a Special Offer!

Trade Recommendations

Unleash the power of deversified trading with our comprehensive portfolio, covering 250+ markets:

  • Stock Trades
  • Crypto Trades
  • Forex Trades
  • Commodity Trades
Elliott Wave Analysis

Gain a competitive edge with expert insights and AI-powered Elliott Wave charting into:

  • Global Indices
  • US Stocks & ASX Stocks
  • Forex & Crypto
  • Commodities
Top-Notch Trading Tools

Equip yourself with the tools of success:

  • Real-time Chat rooms
  • Elliott Wave Algorithm
  • Portfolio tools
  • TradingLevels
  • Screener
  • Trading Game
7 Elliott Wave Analysts

Stay ahead of the market with daily charts and insightful videos
Your secret to strategic trading!

JOIN HERE


Welcome to TradingLounge (ASIC A.R.No. 321187), specialists in trades, trading education and technical analysis, covering stocks, indices, commodities, forex and cryptocurrencies.

When you join TradingLounge you have access to everything we offer, including trade tools, educational content and a social platform to chat with like-minded investors.

Read more

@Copyright 2024 by tradinglounge.com

Contact Us

Australian no: 02 4787 6020

International no: +61 (2) 47876020

Pay with:

Find us on