21Feb

NVDA's Future: NVIDIA Corp. (NVDA) Elliott Wave Technical Analysis Reveals Insights

NVDA Elliott Wave Analysis Trading Lounge Daily Chart,21 February 24

Welcome to our NVDA Elliott Wave Analysis Trading Lounge, your go-to source for comprehensive insights into NVIDIA Corp. (NVDA) using Elliott Wave Technical Analysis. As of the Daily Chart on 21st February 2024, we delve into significant trends guiding the market.

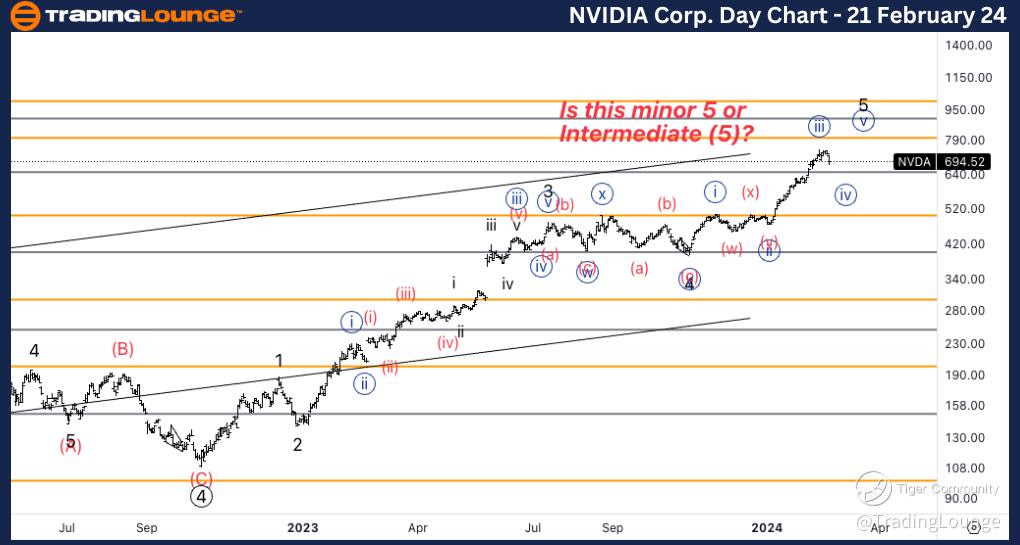
NVDA Elliott Wave Technical Analysis – Daily Chart

In terms of wave dynamics, we identify a dominant impulse function with a motive structure. The current position is in Minor wave 5 of (1), indicating a pullback in wave {iv} of 5. There's a possibility of a larger top being imminent in wave (5), potentially leading to a larger pullback. Additionally, an upside target at TL8 around $800 is plausible.

FUNCTION: Trend  

MODE: Impulsive

STRUCTURE: Motive

POSITION: Minor wave 5 of (1).  

DIRECTION: Pullback in wave {iv} of 5.

DETAILS: As explained on the chart we could be having a larger top soon to be in place in wave (5) instead of 5 and that could mean a larger pullback would be due. In addition, we could see an upside target at TL8 at 800$.

NVIDIA-Corp-day-stoc...


NVDA Elliott Wave Analysis Trading Lounge 4Hr Chart, 21 February 24

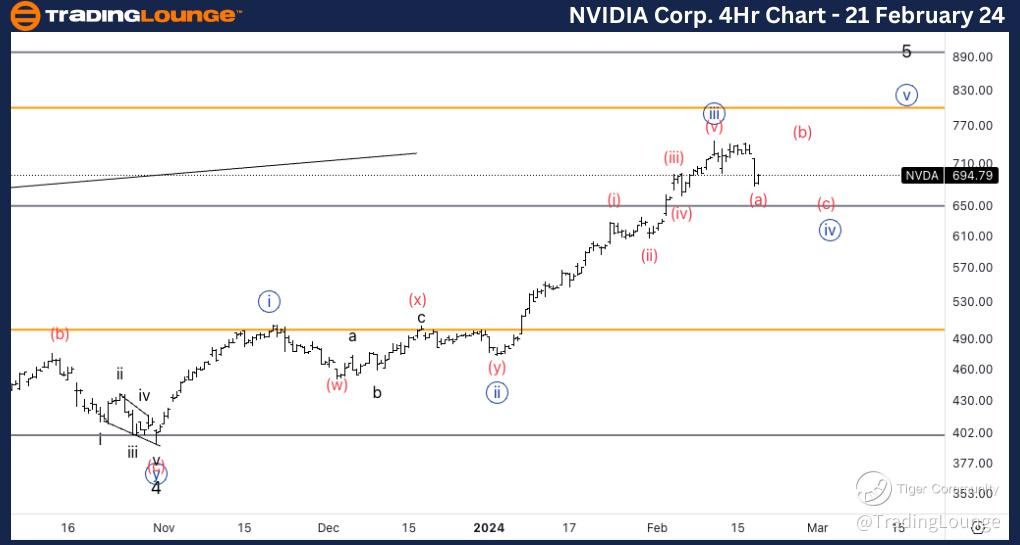
NVDA Elliott Wave Technical Analysis – 4Hr Chart

Here, the wave function shifts to a counter-trend mode with a corrective structure, specifically a flat pattern. The present position is in Wave (a) of {iv}, signifying the completion of a three-wave move in wave {iv}. We anticipate a three-wave move into wave {iv}, with Medium Level support around $650.

FUNCTION: Counter Trend  

MODE: Corrective

STRUCTURE: Flat

POSITION: Wave (a) of {iv}  

DIRECTION: Completion of a three-wave move in wave {iv}.  

DETAILS: Looking for a three-wave move into wave {iv} as of now we would have a much smaller wave {iv} compared to its wave {ii}. We could see Medium Level 650$ act as support.  

Technical Analyst: Alessio Barretta

Source: visit Tradinglounge.com and learn From the Experts Join TradingLounge Here 

See Previous: Microsoft Inc.(MSFT)

NVIDIA-Corp-4h-stock...

Related

BLOCK, INC - XYZ (SQ2) Elliott Wave Analysis & Elliott Wave Technical Chart Predicts Bullish Target with Key Support Holding

BLOCK, INC - XYZ (SQ2) Elliott Wave Analysis & Elliott Wave Technical Chart Predicts Bullish Target with Key Support Holding

This article provides a complete Elliott Wave analysis for ASX: BLOCK INC - SQ2, highlighting a bull...

Read More >
S&P/TSX 60 Index Elliott Wave Technical Analysis Shows Reinforcing the overall Bullish Outlook in both Daily and Weekly Charts

S&P/TSX 60 Index Elliott Wave Technical Analysis Shows Reinforcing the overall Bullish Outlook in both Daily and Weekly Charts

The S&P/TSX 60 is in a bullish trend, according to Elliott Wave analysis. Gray wave 2 of orange wave...

Read More >
Eaton Corp PLC Stocks Elliott Wave Technical Analysis: ETN Currently in an Impulsive Uptrend, Investors Can Gauge Upcoming Opportunities

Eaton Corp PLC Stocks Elliott Wave Technical Analysis: ETN Currently in an Impulsive Uptrend, Investors Can Gauge Upcoming Opportunities

This article provides a comprehensive Elliott Wave analysis of Eaton Corp PLC (ETN) using both daily...

Read More >
Offering a Complete AAVE/USD Trading Insights: AAVEUSD Elliott Wave Technical Analysis and Current Market Trends

Offering a Complete AAVE/USD Trading Insights: AAVEUSD Elliott Wave Technical Analysis and Current Market Trends

This article provides a comprehensive Elliott Wave analysis of AAVEUSD, covering current market tren...

Read More >
The Procter & Gamble Company (PG) Elliott Wave Technical Analysis 9 February 24

The Procter & Gamble Company (PG) Elliott Wave Technical Analysis 9 February 24

Delve into the world of trading with a comprehensive analysis of Procter & Gamble (PG) stock using E...

Read More >
Soybean Elliott Wave Technical Analysis: Market Trend Insights, and Bearish Wave Pattern for Soybean Futures Trading

Soybean Elliott Wave Technical Analysis: Market Trend Insights, and Bearish Wave Pattern for Soybean Futures Trading

Soybean Elliott Wave Analysis, offering insights into price trends, wave patterns, and market foreca...

Read More >

$1 for 2 Weeks

then $29 a month!

What a Special Offer!

Trade Recommendations

Unleash the power of deversified trading with our comprehensive portfolio, covering 250+ markets:

  • Stock Trades
  • Crypto Trades
  • Forex Trades
  • Commodity Trades
Elliott Wave Analysis

Gain a competitive edge with expert insights and AI-powered Elliott Wave charting into:

  • Global Indices
  • US Stocks & ASX Stocks
  • Forex & Crypto
  • Commodities
Top-Notch Trading Tools

Equip yourself with the tools of success:

  • Real-time Chat rooms
  • Elliott Wave Algorithm
  • Portfolio tools
  • TradingLevels
  • Screener
  • Trading Game
7 Elliott Wave Analysts

Stay ahead of the market with daily charts and insightful videos
Your secret to strategic trading!

JOIN HERE


Welcome to TradingLounge (ASIC A.R.No. 321187), specialists in trades, trading education and technical analysis, covering stocks, indices, commodities, forex and cryptocurrencies.

When you join TradingLounge you have access to everything we offer, including trade tools, educational content and a social platform to chat with like-minded investors.

Read more

@Copyright 2024 by tradinglounge.com

Contact Us

Australian no: 02 4787 6020

International no: +61 (2) 47876020

Pay with:

Find us on