13Aug

Specific Price levels and Market Trends for ASX REA GROUP LTD – REA Stock Analysis & Elliott Wave Technical Forecast

ASX: REA GROUP LTD – REA Elliott Wave Analysis (1D Chart)

Greetings, today’s Elliott Wave analysis for the Australian Stock Exchange (ASX) focuses on REA GROUP LTD – REA. Our analysis indicates that REA.ASX may be entering a rising phase within wave ((iii))-navy.

ASX: REA GROUP LTD – REA Elliott Wave Technical Analysis

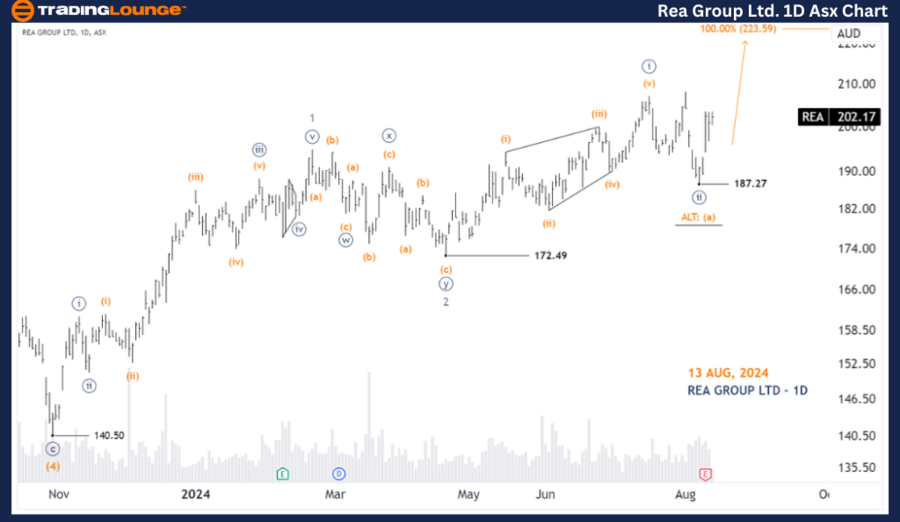
ASX: REA GROUP LTD – 1D Chart (Semilog Scale) Analysis

Function: Major trend (Minor degree, gray)

Mode: Motive

Structure: Impulse

Position: Wave ((iii))-navy

Details: Wave ((ii))-navy has concluded at the recent low of 187.27, suggesting that wave ((iii))-navy is beginning to unfold and push higher. The price must remain above 187.27 to maintain this bullish outlook.

Invalidation Point: 187.27

Rea-Group-ltd-1D-Asx...


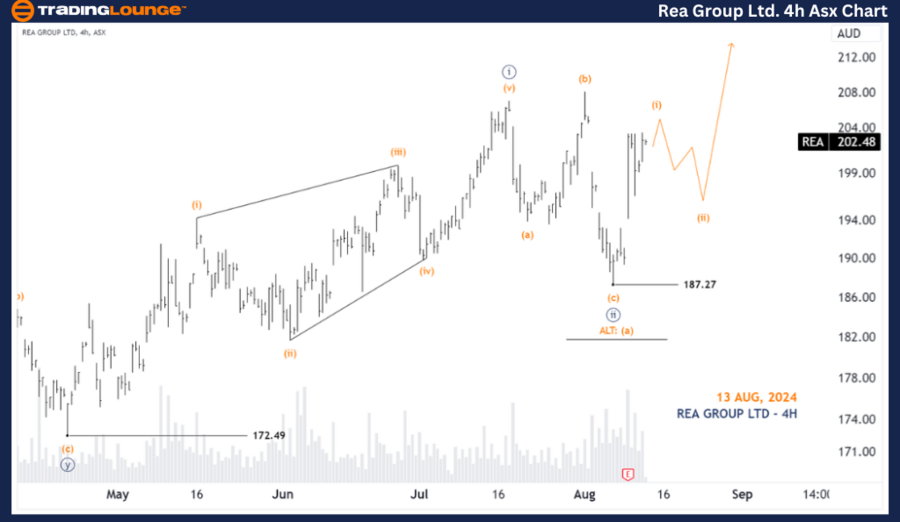
ASX: REA GROUP LTD – REA Elliott Wave Technical Analysis (4-Hour Chart)

ASX: REA GROUP LTD – 4-Hour Chart Analysis

REA Stock Technical Analysis

Function: Major trend (Minute degree, navy)

Mode: Motive

Structure: Impulse

Position: Wave (i)-orange of Wave ((iii))-navy

Details: Following the low at 187.27, wave ((iii))-navy is progressing upwards. It is currently subdividing into wave (i)-orange, which is expected to complete soon. Once wave (ii)-orange unfolds, it should push lower, presenting a potential Long Trade Setup to target wave (iii)-orange.

Invalidation Point: 187.27

Conclusion

Our Elliott Wave analysis of ASX: REA GROUP LTD – REA provides valuable insights into the market's current trends and potential trading opportunities. By identifying specific price levels that validate or invalidate our wave counts, we aim to enhance the accuracy and reliability of our analysis. This approach allows traders to make more informed decisions and capitalize on market movements with greater confidence.

Technical Analyst: Hua (Shane) Cuong, CEWA-M (Master’s Designation).

Source: visit Tradinglounge.com and learn From the Experts Join TradingLounge Here 

Previous:  WISETECH GLOBAL LIMITED Elliott Wave Technical Analysis 

Special Trial Offer - 0.76 Cents a Day for 3 Months! Click here

Access 7 Analysts Over 170 Markets Covered. Chat Room With Support

Rea-Group-ltd-4H-Asx...

Related

Discover the in-depth Deere & Co.(DE) Stocks Elliott Wave Technical Analysis

Discover the in-depth Deere & Co.(DE) Stocks Elliott Wave Technical Analysis

Discover the in-depth Elliott Wave Analysis for Deere & Co. (DE), focusing on daily and 4-hour chart...

Read More >
"Elliott Wave Analysis: NASDAQ 100, SP500, and Top Tech Stocks - Trading Strategies and Market Forecast"

"Elliott Wave Analysis: NASDAQ 100, SP500, and Top Tech Stocks - Trading Strategies and Market Forecast"

This analysis covers the Elliott Wave patterns for NASDAQ 100, SP500, and major tech stocks like App...

Read More >
KOSPI Composite Index provides valuable insights into daily and weekly trends using Elliott Wave Analysis

KOSPI Composite Index provides valuable insights into daily and weekly trends using Elliott Wave Analysis

This comprehensive analysis of the KOSPI Composite Index provides valuable insights into daily and w...

Read More >
Learn how to utilize important indicators: XRP Crypto Price News Today XRP/USD Elliott Wave Technical Analysis

Learn how to utilize important indicators: XRP Crypto Price News Today XRP/USD Elliott Wave Technical Analysis

Get an in-depth analysis of XRP/USD with our latest Elliott Wave technical analysis. Understand the ...

Read More >
Technical Breakdown Provides THETAUSD Elliott Wave Forecast: Offering Fibonacci Targets, Trade Strategies, and Invalidation Levels

Technical Breakdown Provides THETAUSD Elliott Wave Forecast: Offering Fibonacci Targets, Trade Strategies, and Invalidation Levels

This technical breakdown provides Elliott Wave analysis for THETAUSD, offering Fibonacci targets, tr...

Read More >
Swiss Market Index Elliott Wave Technical Analysis: Covers All Essential Aspects of SMI Trading  and Looking for Bullish Trends

Swiss Market Index Elliott Wave Technical Analysis: Covers All Essential Aspects of SMI Trading and Looking for Bullish Trends

This article thoroughly analyses the Swiss Market Index (SMI) using Elliott Wave theory, offering va...

Read More >

$1 for 2 Weeks

then $29 a month!

What a Special Offer!

Trade Recommendations

Unleash the power of deversified trading with our comprehensive portfolio, covering 250+ markets:

  • Stock Trades
  • Crypto Trades
  • Forex Trades
  • Commodity Trades
Elliott Wave Analysis

Gain a competitive edge with expert insights and AI-powered Elliott Wave charting into:

  • Global Indices
  • US Stocks & ASX Stocks
  • Forex & Crypto
  • Commodities
Top-Notch Trading Tools

Equip yourself with the tools of success:

  • Real-time Chat rooms
  • Elliott Wave Algorithm
  • Portfolio tools
  • TradingLevels
  • Screener
  • Trading Game
7 Elliott Wave Analysts

Stay ahead of the market with daily charts and insightful videos
Your secret to strategic trading!

JOIN HERE


Welcome to TradingLounge (ASIC A.R.No. 321187), specialists in trades, trading education and technical analysis, covering stocks, indices, commodities, forex and cryptocurrencies.

When you join TradingLounge you have access to everything we offer, including trade tools, educational content and a social platform to chat with like-minded investors.

Read more

@Copyright 2024 by tradinglounge.com

Contact Us

Australian no: 02 4787 6020

International no: +61 (2) 47876020

Pay with:

Find us on