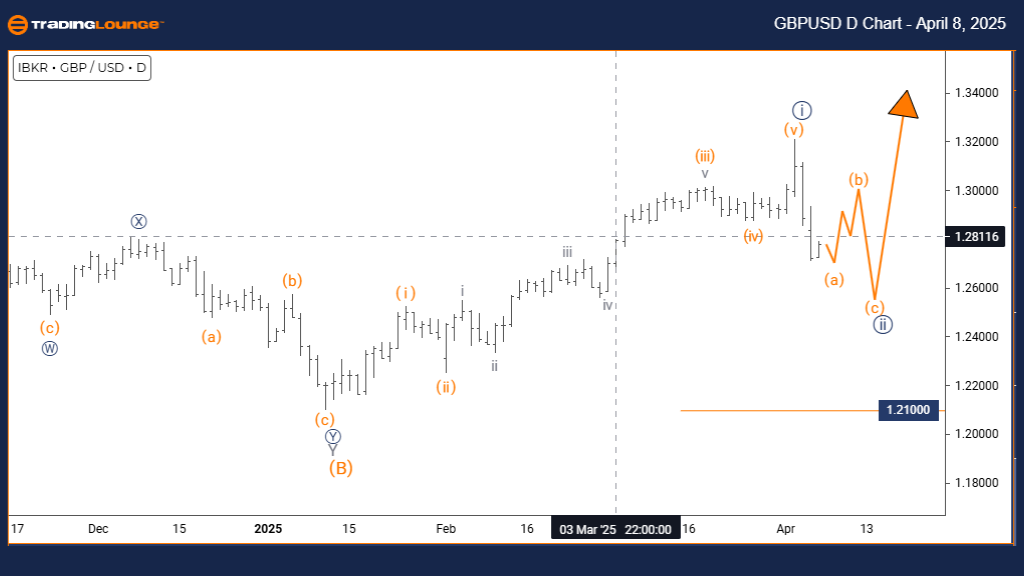
GBPUSD Elliott Wave Forecast – TradingLounge Daily Chart
British Pound / U.S. Dollar (GBPUSD) Daily Chart Analysis
British Pound / U.S. Dollar (GBPUSD) Elliott Wave Forecast & Technical Analysis
Function: Counter-Trend
Mode: Corrective
Structure: Navy Blue Wave 2
Position: Gray Wave 1
Next Higher Degree Direction: Navy Blue Wave 3
Invalidation Level: 1.21000
Daily Analysis Summary:
In the daily GBPUSD Elliott Wave forecast, price action shows a corrective counter-trend development, specifically within Navy Blue Wave 2, inside the broader Gray Wave 1 structure.
Technical signals confirm the end of Navy Blue Wave 1, transitioning into a corrective Wave 2 phase. This signals a temporary retracement before a potential advance into Navy Blue Wave 3, aligning with the larger bullish trend.
The key invalidation level remains at 1.21000. A break below this would negate the current wave outlook and require reevaluation of the structure.
Market Outlook & Trading Strategy:
This corrective phase within Navy Blue Wave 2 is an essential part of the Elliott Wave structure, reflecting the market’s consolidation before continuation.
Traders should anticipate classic corrective patterns—such as ABC formations or sideways moves—that typically occur during Wave 2 phases of Elliott structures.
Trading Plan:
- Short-Term Traders: Monitor for signals of Wave 2 completion for strategic entries.
- Long-Term Investors: View the pullback as a setup for the next impulsive rally.
- Key Technical Level: Remain focused on the 1.21000 invalidation point.
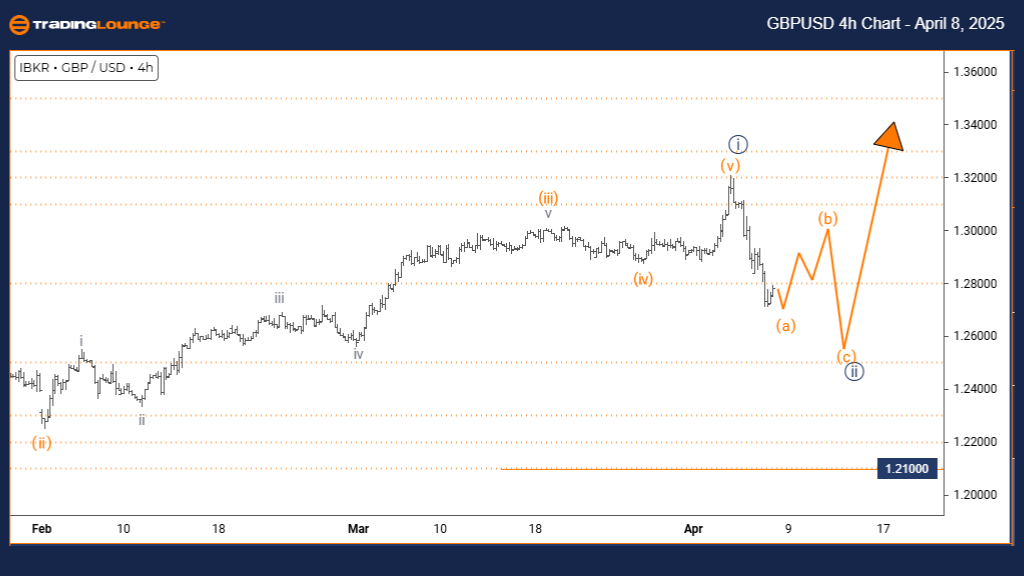
GBPUSD Elliott Wave Forecast – TradingLounge 4-Hour Chart
British Pound / U.S. Dollar (GBPUSD) Elliott Wave Forecast & Technical Analysis
Function: Counter-Trend
Mode: Corrective
Structure: Navy Blue Wave 2
Position: Gray Wave 1
Next Higher Degree Direction: Navy Blue Wave 3
Invalidation Level: 1.21000
4-Hour Analysis Summary:
The 4-hour GBPUSD Elliott Wave forecast highlights a counter-trend scenario as the pair moves through a corrective Navy Blue Wave 2 within Gray Wave 1.
With Navy Blue Wave 1 completed, the current retracement marks a corrective phase before potential continuation higher. This presents a key opportunity to prepare for the start of Navy Blue Wave 3.
Invalidation sits firmly at 1.21000—any move below signals a need to revise the current wave count.
Wave Structure Insights & Strategy:
Wave 2 corrections often feature three-wave ABC patterns or flat consolidations. Recognizing these setups is vital for capturing trend resumption trades.
Trading Strategy:
- Short-Term Focus: Take advantage of corrective dips within Wave 2.
- Long-Term View: Anticipate entry into Wave 3’s impulse phase.
- Risk Level: Stay vigilant on the 1.21000 invalidation level.
Technical Analyst: Malik Awais
Source: Visit Tradinglounge.com and learn from the Experts Join TradingLounge Here
Previous: USDJPY Elliott Wave Technical Analysis
VALUE Offer - Buy 1 Month & Get 3 Months!Click here
Access 7 Analysts Over 200 Markets Covered. Chat Room With Support