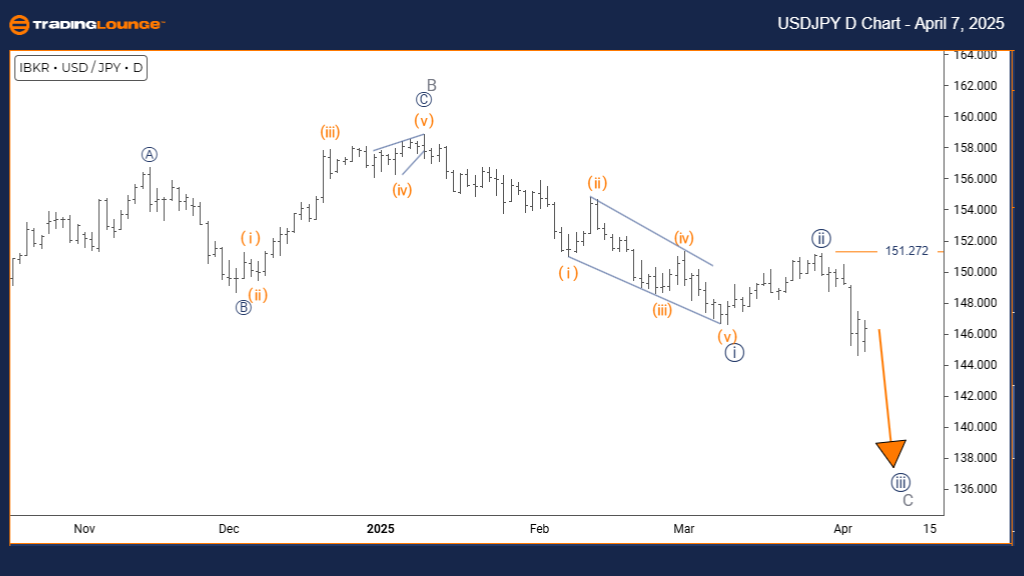
U.S. Dollar / Japanese Yen (USDJPY) Elliott Wave Technical Analysis – Trading Lounge Daily Chart
USDJPY Elliott Wave Technical Analysis
Technical Overview
Function: Counter-Trend
Mode: Impulsive
Wave Structure: Navy Blue Wave 3
Current Position: Gray Wave C
Higher Degree Direction: Navy Blue Wave Progression
Invalidation Level: 151.272
USDJPY Elliott Wave Summary – Daily Perspective
The USDJPY pair is navigating a counter-trend structure within a broader Elliott Wave framework. The current configuration places navy blue wave 3 at the forefront, progressing inside a gray wave C pattern. The prior phase, navy blue wave 2, appears complete, giving rise to the ongoing impulsive wave 3.
This evolving structure indicates a medium-term directional change for USDJPY. A break above the 151.272 invalidation level would prompt a revision of the wave count and overall scenario.
Analytical Insights
- Navy blue wave 3 represents a classic impulsive wave, typically linked with stronger price movement and heightened momentum.
- The location of this wave within wave C provides both immediate and long-range forecasting advantages.
- Identifying impulsive behavior within this setup helps validate the current trend strength and informs risk management.
Trading Implications
Traders should actively track this wave development to seize both short-term and longer-term trading opportunities. The daily timeframe delivers a dependable overview for positioning within the evolving Elliott Wave roadmap.
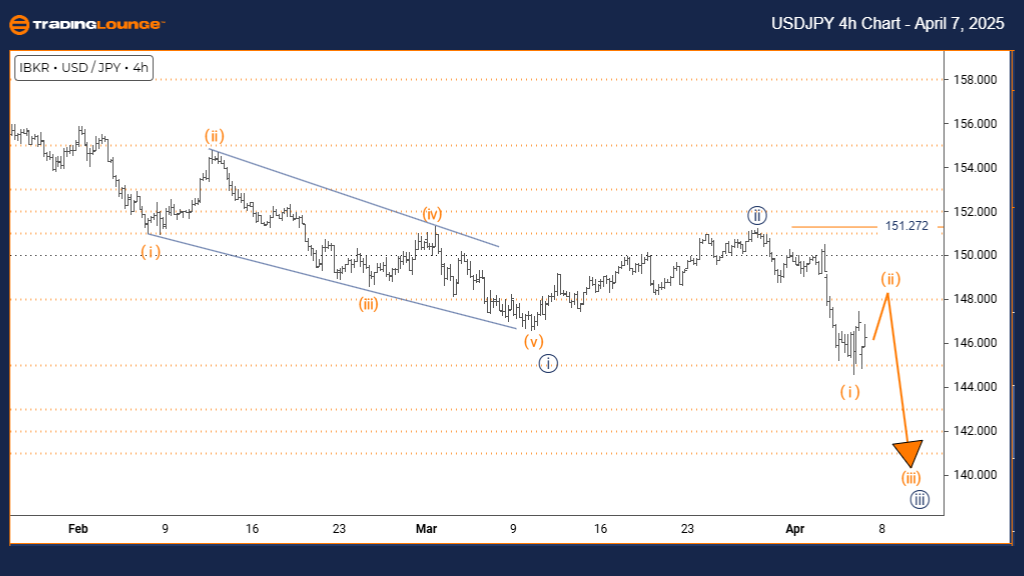
U.S. Dollar / Japanese Yen (USDJPY) Elliott Wave Technical Analysis – Trading Lounge Daily Chart
Technical Overview
Function: Counter-Trend
Mode: Corrective
Wave Structure: Orange Wave 2
Current Position: Navy Blue Wave 3
Next Lower Degree: Orange Wave 3
Invalidation Level: 151.272
USDJPY Elliott Wave Summary – 4H Perspective
On the 4-hour chart, USDJPY is in a corrective stage, developing within orange wave 2. This movement follows the impulsive completion of orange wave 1, forming part of the overarching navy blue wave 3.
Traders are now assessing this retracement phase, awaiting signs of completion before the expected start of the impulsive orange wave 3. Should the pair rise above 151.272, the wave count will need reevaluation.
Analytical Insights
- Orange wave 2 typically exhibits a corrective three-wave pattern or consolidation, aligning with a counter-trend setup.
- Its placement inside navy blue wave 3 offers insights for both short-term price action and broader directional trends.
- Successful identification of wave 2 completion may provide a strong entry point for a bullish move into wave 3.
Trading Implications
This wave structure creates valuable opportunities for both intraday traders and long-term investors. Key focus should remain on signs of the corrective wave ending, setting the stage for entry into the next impulsive leg.
Technical Analyst: Malik Awais
Source: Visit Tradinglounge.com and learn from the Experts Join TradingLounge Here
Previous: USDCHF Elliott Wave Technical Analysis
VALUE Offer - Buy 1 Month & Get 3 Months!Click here
Access 7 Analysts Over 200 Markets Covered. Chat Room With Support