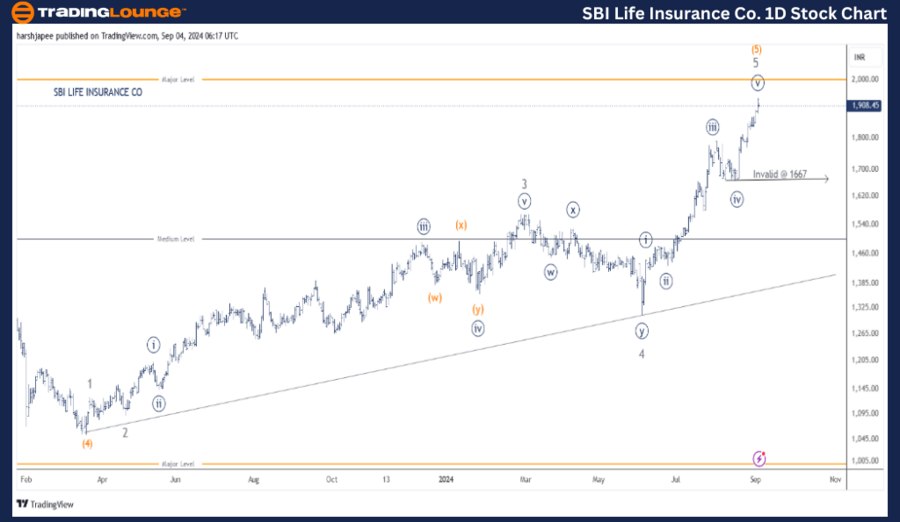
SBI LIFE INSURANCE CO – SBILIFE Elliott Wave Analysis (1D Chart)

SBI LIFE  Stock Technical Analysis

Function: Larger Degree Trend Higher (Intermediate Degree, Orange)

Mode: Motive

Structure: Impulse

Position: Minute Wave ((v)) Grey

Details: Minute Wave ((v)) appears complete near 1940 or could be nearing its end within Minor Wave 5 Grey of Intermediate Wave (5) Orange. Traders are encouraged to book profits at this level.

Invalidation Point: 1667

SBILIFE Elliott Wave Technical Analysis

SBI Life Insurance Co Daily Chart Technical Analysis and Potential Elliott Wave Counts

The SBI Life Insurance Co daily chart suggests a possible top forming near the 1940 level on Tuesday, September 13, 2024. The stock opened lower in line with the Nifty 50 Index and is trading near 1910 at the time of writing.

It’s possible that SBI Life Insurance has completed its fifth wave across multiple degrees, including Minute, Minor, and Intermediate, as indicated on the daily chart. The rally, which began from the March 2023 low of 1050, may now be over.

If these wave counts are accurate, SBI Life could move lower, with a break below 1667, which is Minute Wave ((iv)), signaling a stronger bearish trend. Traders should consider booking profits on previously held long positions.

SBI-Life-Insurance-C...


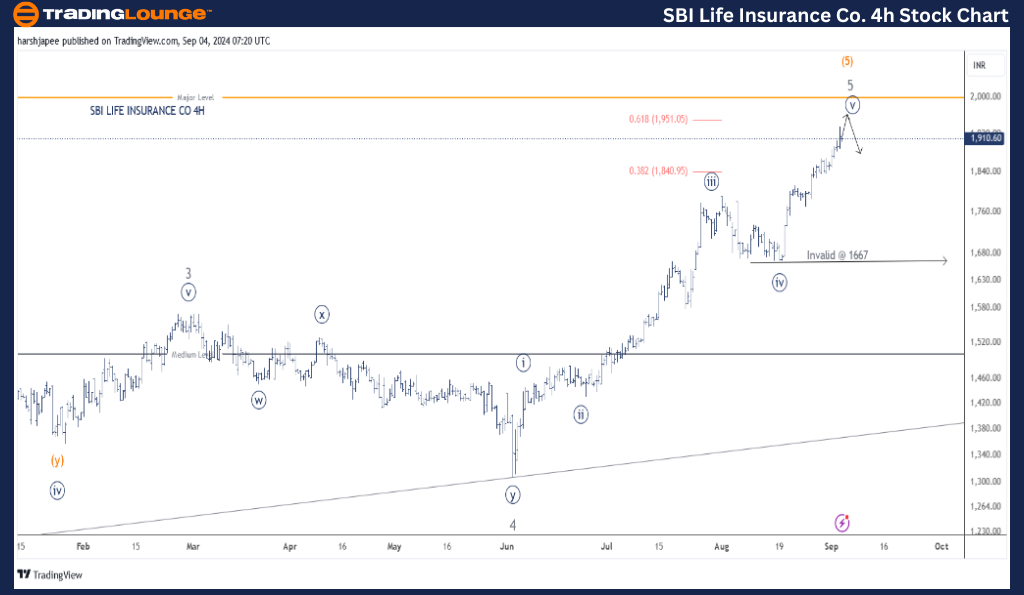
SBI LIFE INSURANCE CO – SBILIFE (4H Chart) Elliott Wave Technical Analysis

Function: Larger Degree Trend Higher (Intermediate Degree, Orange)

Mode: Motive

Structure: Impulse

Position: Minute Wave ((v)) Grey

Details: Minute Wave ((v)) appears complete near 1940 and could be reaching its end near the 1950 level, within Minor Wave 5 Grey of Intermediate Wave (5) Orange. Traders are advised to book profits at these levels.

Invalidation Point: 1667

SBI Life Insurance Co 4H Chart Technical Analysis and Potential Elliott Wave Counts

The SBI Life Insurance Co 4H chart also shows that Minute Wave ((v)) Navy might have completed at the 1940 high. The stock’s near-term support is around 1838, and a break below this level could signal a more significant reversal. Resistance may also be encountered around the 1950 level.

Additionally, the Fibonacci 1.618 extension of Minor Wave 5 indicates a potential resistance near 1951. Bulls may make a final upward move before the trend reverses. Either way, a top appears to be forming.

Technical Analyst: Harsh Japee

Source: visit Tradinglounge.com and learn From the Experts Join TradingLounge Here 

Previous: ICICI BANK Elliott Wave Technical Analysis

Special Trial Offer - 0.76 Cents a Day for 3 Months! Click here

Access 7 Analysts Over 200 Markets Covered. Chat Room With Support

SBI-Life-Insurance-C...


Conclusion

SBI Life Insurance Co could have completed Minute Wave ((v)) within Minor Wave 5 Grey of Intermediate Wave (5) Orange near the 1940 level.

Related

EURGBP Elliott WaveTechnical Analysis: Bearish Trend, Orange Wave 3 Progression, Risk Management Insights, and Forex Trading Strategies

EURGBP Elliott WaveTechnical Analysis: Bearish Trend, Orange Wave 3 Progression, Risk Management Insights, and Forex Trading Strategies

This comprehensive analysis delves into EURGBP Elliott Wave structures, highlighting the ongoing bea...

Read More >
In-Depth Cocoa Elliott Wave Analysis: Accurate Price Forecasts, Market Trends, and Commodity Trading Strategies

In-Depth Cocoa Elliott Wave Analysis: Accurate Price Forecasts, Market Trends, and Commodity Trading Strategies

Explore our detailed Cocoa Elliott Wave Analysis to stay ahead in the commodity market. Learn about ...

Read More >
Commodities & Futures Market Analysis: Elliott Wave Insights & Strategies

Commodities & Futures Market Analysis: Elliott Wave Insights & Strategies

COMMODITY MARKETS: Bond Yields, USD Dollar DXY, US Gold, Silver, Iron Ore,Copper, Uranium, Oil, Gas

Read More >
Shanghai Composite Elliott Wave Analysis: Unlock Market Trends, Predict Future Moves & Maximize Your Trading Profits!

Shanghai Composite Elliott Wave Analysis: Unlock Market Trends, Predict Future Moves & Maximize Your Trading Profits!

This Shanghai Composite Elliott Wave Analysis provides a detailed outlook on the current stock marke...

Read More >
USDJPY Elliott Wave Analysis: Strong Bearish Trend, Orange Wave 3 Setups, Trading Strategies, and Daily/4H Chart Forecast

USDJPY Elliott Wave Analysis: Strong Bearish Trend, Orange Wave 3 Setups, Trading Strategies, and Daily/4H Chart Forecast

Detailed USDJPY Elliott Wave analysis highlighting a strong bearish trend and trading opportunities ...

Read More >
Neo/ U.S. dollar(NEOUSD) Elliott Wave Technical Analysis: Riding the Uptrend Wave

Neo/ U.S. dollar(NEOUSD) Elliott Wave Technical Analysis: Riding the Uptrend Wave

Explore our latest NEO/USD Elliott Wave Analysis for March 6, 2024, to uncover valuable insights int...

Read More >

$1 for 2 Weeks

then $29 a month!

What a Special Offer!

Trade Recommendations

Unleash the power of deversified trading with our comprehensive portfolio, covering 250+ markets:

  • Stock Trades
  • Crypto Trades
  • Forex Trades
  • Commodity Trades
Elliott Wave Analysis

Gain a competitive edge with expert insights and AI-powered Elliott Wave charting into:

  • Global Indices
  • US Stocks & ASX Stocks
  • Forex & Crypto
  • Commodities
Top-Notch Trading Tools

Equip yourself with the tools of success:

  • Real-time Chat rooms
  • Elliott Wave Algorithm
  • Portfolio tools
  • TradingLevels
  • Screener
  • Trading Game
7 Elliott Wave Analysts

Stay ahead of the market with daily charts and insightful videos
Your secret to strategic trading!

JOIN HERE


Welcome to TradingLounge (ASIC A.R.No. 321187), specialists in trades, trading education and technical analysis, covering stocks, indices, commodities, forex and cryptocurrencies.

When you join TradingLounge you have access to everything we offer, including trade tools, educational content and a social platform to chat with like-minded investors.

Read more

@Copyright 2024 by tradinglounge.com

Contact Us

Australian no: 02 4787 6020

International no: +61 (2) 47876020

Pay with:

Find us on