20Nov

Analyze AAVEUSD with Detailed Elliott Wave Analysis Focusing on bullish trends, price predictions, and strategic trading insights

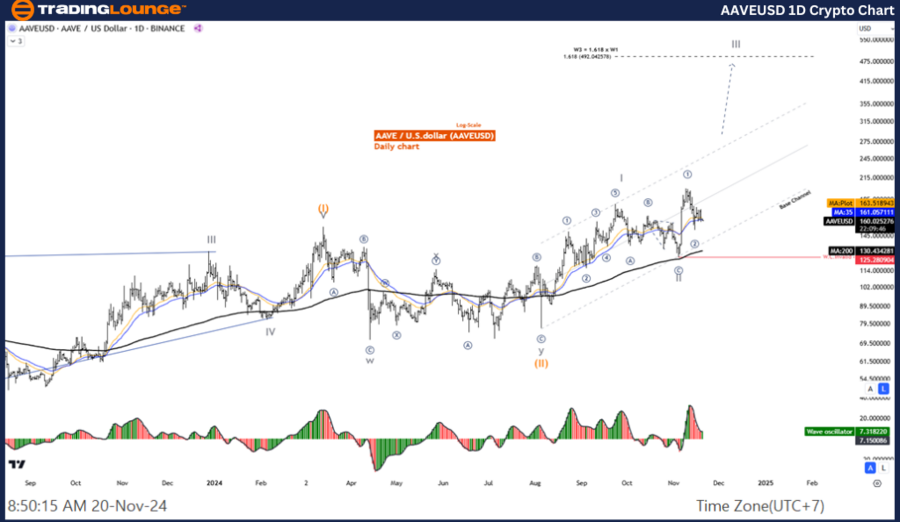
AAVEUSD Elliott Wave Analysis | TradingLounge Day Chart

AAVE/USD (AAVEUSD) Chart Analysis

AAVEUSD Elliott Wave Technical Analysis

Function: Follow Trend

Mode: Motive

Structure: Impulse

Position: Wave III

Direction (Next Higher Degrees): Wave (III) of Impulse

Wave Cancel Invalid Level: 125.280

Details: The five-wave structure is likely to rise further, testing the 492 level.

AAVE/USD Trading Strategy

  • The correction in Wave 2 appears to have concluded, paving the way for a five-wave rally in Wave 3.

  • Price action maintains an uptrend, prompting a focus on re-entering the trend as opportunities arise.

AAVE/USD Technical Indicators

  • Moving Average: The price is positioned above the MA200, signaling a sustained uptrend.

  • Wave Oscillator: Indicates strong bullish momentum, supporting further upward movement.

AAVEUSD-1D-Crypto-Ch...


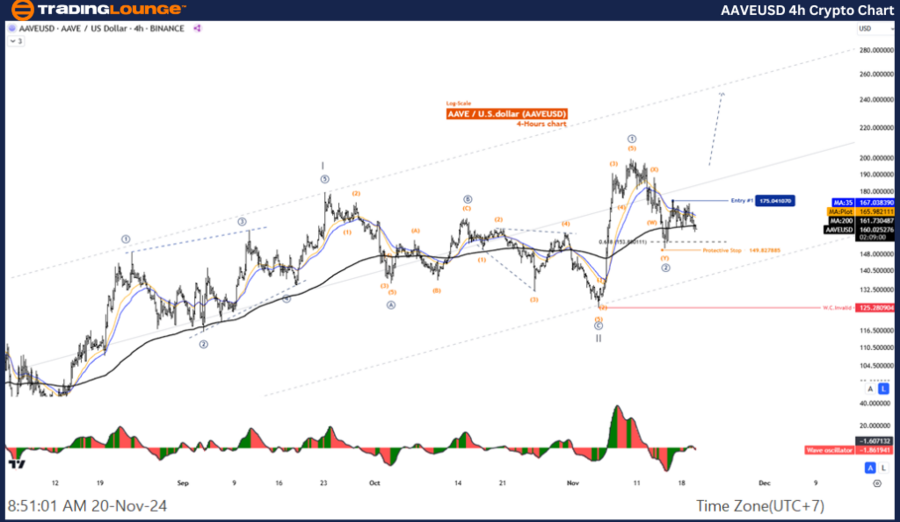
AAVE/USD (AAVEUSD) 4-Hour Chart

AAVEUSD Elliott Wave Technical Analysis

Function: Counter Trend

Mode: Corrective

Structure: Double Corrective

Position: Wave (Y)

Direction (Next Higher Degrees): Wave ((2)) of Impulse

Wave Cancel Invalid Level: 125.280

Details: The current corrective structure of Wave ((2)) is anticipated to complete before transitioning into an upward Wave ((3)).

AAVE/USD Trading Strategy

  • The corrective phase in Wave 2 is likely over, shifting focus to the potential five-wave rally of Wave 3.

  • Price action remains aligned with the broader uptrend, offering strategic re-entry points to capitalize on the bullish momentum.

AAVE/USD Technical Indicators

  • Moving Average: The price remains above the MA200, affirming an ongoing uptrend.

  • Wave Oscillator: Signals bullish momentum, reinforcing the likelihood of further price increases.

Technical Analyst: Malik Awais

Source: visit Tradinglounge.com and learn From the Experts Join TradingLounge Here 

Previous: BTCUSD Elliott Wave Technical Analysis

VALUE Offer - Buy 1 Month & Get 3 Months!Click here

Access 7 Analysts Over 200 Markets Covered. Chat Room With Support

AAVEUSD-4h-Crypto-Ch...

Related

S&P BSE Sensex (India) Elliott Wave Analysis: Bullish Trend Forecast, Impulse Wave Patterns, Stock Market Outlook & Trading Strategy

S&P BSE Sensex (India) Elliott Wave Analysis: Bullish Trend Forecast, Impulse Wave Patterns, Stock Market Outlook & Trading Strategy

Elliott Wave forecast for the S&P BSE Sensex, covering both daily and weekly charts. It confirms a b...

Read More >
Elliott Wave Trading Strategies for SP500, NASDAQ, Tech Giants & Bitcoin

Elliott Wave Trading Strategies for SP500, NASDAQ, Tech Giants & Bitcoin

The Expanded Wave IV correction for U.S. indices is nearly complete, with expectations of one more l...

Read More >
Alphabet Inc. (GOOGL) Stocks Technical Analysis: Potential Stock Price Movements and Market Trends using Elliott Wave Theory

Alphabet Inc. (GOOGL) Stocks Technical Analysis: Potential Stock Price Movements and Market Trends using Elliott Wave Theory

This article provides a detailed Elliott Wave analysis of Alphabet Inc. (GOOGL), focusing on daily a...

Read More >
Elliott Wave Technical Analysis for Caterpillar (CAT) US Stock: Wave iv Completion Near Support, Targeting $380 Upside Momentum

Elliott Wave Technical Analysis for Caterpillar (CAT) US Stock: Wave iv Completion Near Support, Targeting $380 Upside Momentum

Detailed Elliott Wave breakdown for Caterpillar (CAT): wave (iv) completion, support at $350, projec...

Read More >
Soybean Elliott Wave Technical Analysis: Market Trend Insights, and Bearish Wave Pattern for Soybean Futures Trading

Soybean Elliott Wave Technical Analysis: Market Trend Insights, and Bearish Wave Pattern for Soybean Futures Trading

Soybean Elliott Wave Analysis, offering insights into price trends, wave patterns, and market foreca...

Read More >
XOM Elliott Wave Analysis: Technical Insights on Exxon Mobil Corp. - 5 February 24

XOM Elliott Wave Analysis: Technical Insights on Exxon Mobil Corp. - 5 February 24

This Elliott Wave analysis of Exxon Mobil Corp. (XOM) on both daily and 4-hour charts provides valua...

Read More >

$1 for 2 Weeks

then $29 a month!

What a Special Offer!

Trade Recommendations

Unleash the power of deversified trading with our comprehensive portfolio, covering 250+ markets:

  • Stock Trades
  • Crypto Trades
  • Forex Trades
  • Commodity Trades
Elliott Wave Analysis

Gain a competitive edge with expert insights and AI-powered Elliott Wave charting into:

  • Global Indices
  • US Stocks & ASX Stocks
  • Forex & Crypto
  • Commodities
Top-Notch Trading Tools

Equip yourself with the tools of success:

  • Real-time Chat rooms
  • Elliott Wave Algorithm
  • Portfolio tools
  • TradingLevels
  • Screener
  • Trading Game
7 Elliott Wave Analysts

Stay ahead of the market with daily charts and insightful videos
Your secret to strategic trading!

JOIN HERE


Welcome to TradingLounge (ASIC A.R.No. 321187), specialists in trades, trading education and technical analysis, covering stocks, indices, commodities, forex and cryptocurrencies.

When you join TradingLounge you have access to everything we offer, including trade tools, educational content and a social platform to chat with like-minded investors.

Read more

@Copyright 2024 by tradinglounge.com

Contact Us

Australian no: 02 4787 6020

International no: +61 (2) 47876020

Pay with:

Find us on