Copper Commodity Elliott Wave Analysis

Function: Trend

Mode: Impulse

Structure: Impulse Wave

Position: Wave 4

Direction: Wave 4 is in progress

Details: Blue wave 'b' should start soon, but price commitment to the upside is needed first.

Copper Elliott Wave Technical Analysis

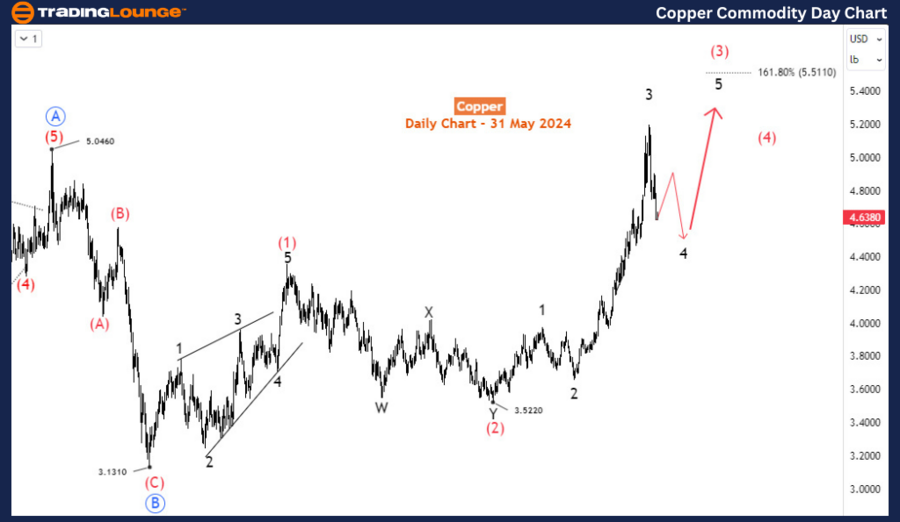
Copper is currently experiencing a pullback from a year-long impulse wave structure. This presents an opportunity for buyers to wait for the next low before entering the market, as the larger bullish structure that began in July 2022 remains intact. However, the ongoing pullback from May 17th is not yet complete, so buyers will likely need to wait a few more weeks before the next rally.

Copper Daily Chart Analysis

The daily chart indicates that a corrective structure concluded at 3.131 in July 2022. This correction followed an impulse wave that began in March 2020 and ended in July 2022 at 5.046. The high at 5.046 and the low at 3.131 are labeled as primary degree waves A and B (circled in blue), respectively. The corresponding wave C (circled in blue) started at the 3.131 low in July 2022 and has developed into a bullish impulse wave sequence. Currently, the price is in intermediate wave (3) of blue wave C, which is expected to extend to at least 5.511, suggesting further upside potential. The ongoing pullback is identified as wave 4 of (3). Once wave 4 concludes, wave 5 should advance towards 5.511. To gauge the completion of wave 4, it is essential to analyze its sub-waves and emerging structure.
Copper-Day-Commodity...


Copper 4-Hour Chart Analysis

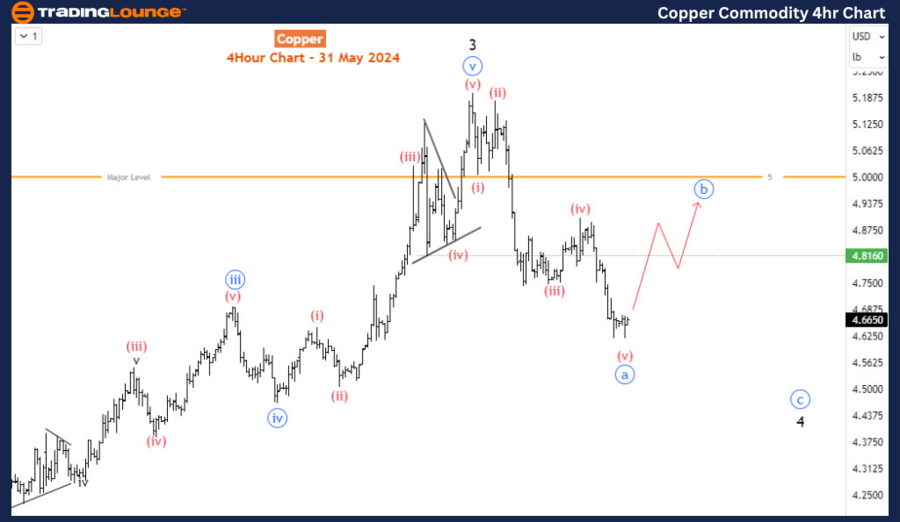
The H4 chart shows that the decline from the top of wave 3 (May 2024 high) is forming an impulse wave. This suggests that wave 4 is likely forming a zigzag pattern, subdividing into waves a-b-c (circled in blue). The current bearish impulse is nearing the completion of blue wave ‘a’, after which wave ‘b’ is expected to move upwards, followed by a final leg down for wave ‘c’. This is the ideal scenario for the current market structure.

In summary, copper prices are in a pullback phase from a significant impulse wave, and buyers should wait for this correction to conclude before entering the market. The larger bullish structure that started in July 2022 is still intact, with intermediate wave (3) of blue wave C potentially extending to 5.511. The current pullback, identified as wave 4 of (3), is forming a zigzag pattern, with the H4 chart showing the development of waves a-b-c. Monitoring the completion of wave 4 will be crucial for timing the next entry point, as wave 5 is expected to push prices higher towards the target of 5.511.

Technical Analyst: Sanmi Adeagbo

Source: visit Tradinglounge.com and learn From the Experts Join TradingLounge Here 

See Previous: Soybeans Elliott Wave Analysis

Special Trial Offer - 0.76 Cents a Day for 3 Months! Click here

Access 7 Analysts Over 170 Markets Covered. Chat Room With Support
Copper-4hr-commodity...

Related

Mastering ChainLink: In-Depth Crypto Price News Today Elliott Wave Technical Analysis

Mastering ChainLink: In-Depth Crypto Price News Today Elliott Wave Technical Analysis

This article provides a detailed Elliott Wave analysis of ChainLink (LINKUSD), offering key insights...

Read More >
Binance Coin Crypto News Today: Elliott Wave Technical Analysis of BNB/USD Navigating the Bullish Momentum

Binance Coin Crypto News Today: Elliott Wave Technical Analysis of BNB/USD Navigating the Bullish Momentum

Dive into the world of cryptocurrency with our detailed Elliott Wave analysis of BNB/USD. This guide...

Read More >
BTCUSD Elliott Wave analysis: Insights into Bitcoin's Wave Count, Potential Trend Reversals, and Price Movement Forecasts

BTCUSD Elliott Wave analysis: Insights into Bitcoin's Wave Count, Potential Trend Reversals, and Price Movement Forecasts

This article provides a detailed BTCUSD Elliott Wave analysis, focusing on Bitcoin's current mar...

Read More >
GX Uranium ETF Elliott Wave Technical Analysis: Price Prediction, and Investment Opportunities in the Uranium Sector

GX Uranium ETF Elliott Wave Technical Analysis: Price Prediction, and Investment Opportunities in the Uranium Sector

GX Uranium ETF with the detailed Elliott Wave analysis. Understand key support levels, market trends...

Read More >
Expert EURGBP Elliott Wave Analysis: Uncover Trends, Forecasts, and Proven Trading Strategies for Success

Expert EURGBP Elliott Wave Analysis: Uncover Trends, Forecasts, and Proven Trading Strategies for Success

This article provides an in-depth EURGBP Elliott Wave analysis, focusing on the current wave count, ...

Read More >
Currency Pair Australian Dollar and Japanese Yen (AUDJPY) Elliott Wave Technical Analysis and Forex Signals

Currency Pair Australian Dollar and Japanese Yen (AUDJPY) Elliott Wave Technical Analysis and Forex Signals

Our comprehensive AUDJPY Elliott Wave analysis provides valuable insights into market trends, correc...

Read More >

Buy 1 Month

Get 3 Months!

Special Offer:

Trade Recommendations

Unleash the power of deversified trading with our comprehensive portfolio, covering:

  • Stock Trades
  • Crypto Trades
  • Forex Trades
  • Commodity Trades
Elliott Wave Analysis

Gain a competive edge with expert insights in to:

  • Global Indices
  • US Stocks & ASX Stocks
  • Forex & Crypto
  • Commodities
Top-Notch Trading Tools

Equip yourself with the tools of success:

  • Social Chat
  • Elliott Wave Algorithm
  • Screener
  • TradingLevels
  • Trading Game
7 Elliott Wave Analysts

Stay ahead of the market with daily charts and insightful videos
-Your secret to strategic trading!

JOIN HERE


Welcome to TradingLounge (ASIC A.R.No. 321187), specialists in trades, trading education and technical analysis, covering stocks, indices, commodities, forex and cryptocurrencies.

When you join TradingLounge you have access to everything we offer, including trade tools, educational content and a social platform to chat with like-minded investors.

Read more

@Copyright 2024 by tradinglounge.com

Contact Us

Australian no: 02 4787 6020

International no: +61 (2) 47876020

Pay with:

Find us on