Soybeans Elliott Wave Analysis 

Function - Trend 

Mode - Impulse 

Structure - Double Zigzag for (2)

Position - Wave 1 of (3)

Direction - Wave 1 of (3) 

Details - Wave 1 of (3) broke to the downside and is now leaving the congestion area. More downside is expected especially if blue wave ‘iv’ of C of (2) is breached. Same as the previous update.

Soybeans Elliott Wave Technical Analysis

Soybean prices appear to have completed a corrective structure that began in late February and could now be resuming the long-term bearish trend. In this analysis, we will also consider an alternative scenario in case the corrective bounce from late February has not yet concluded.

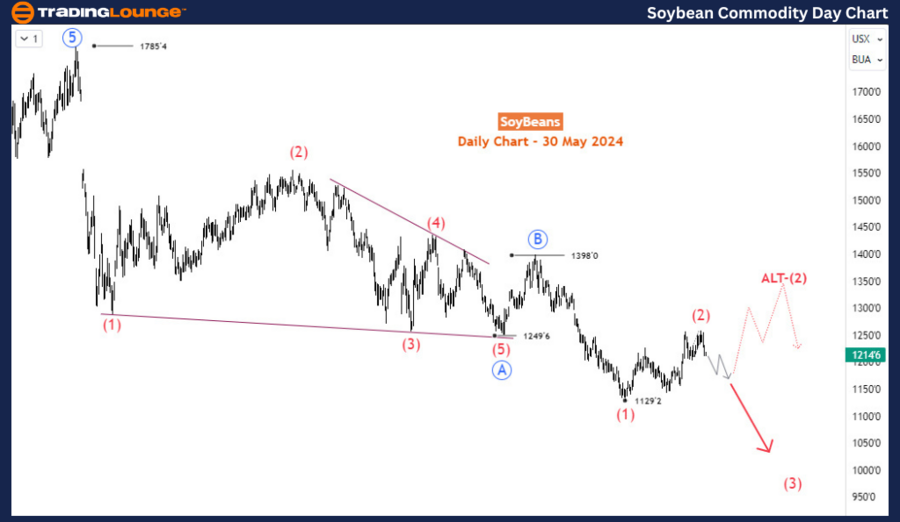
Soybean Daily Chart Analysis

On the daily chart, a bearish cycle began in June 2022 at 1785. Following nearly two years of sell-off, we can identify the emerging bearish structure as a zigzag subdivided into the primary degree waves A-B-C (circled in blue). In October 2023, blue wave A ended with a diagonal at 1249’6, followed by a shallow corrective bounce for blue wave B up to 1398. Since reaching 1398 in November 2023, a bearish impulse wave (1) of blue wave C concluded at 1129 in late February 2024, where the current corrective bounce initiated. Currently, prices are in wave (2). Wave (2) completed a zigzag structure and might now be heading below 1129 for wave (3). Alternatively, there could be a corrective pullback above 1129, leading to a double zigzag rally for wave (2). Regardless of the scenario, a sell-off in the coming days seems likely.

Soybeans-Day-Commodi...


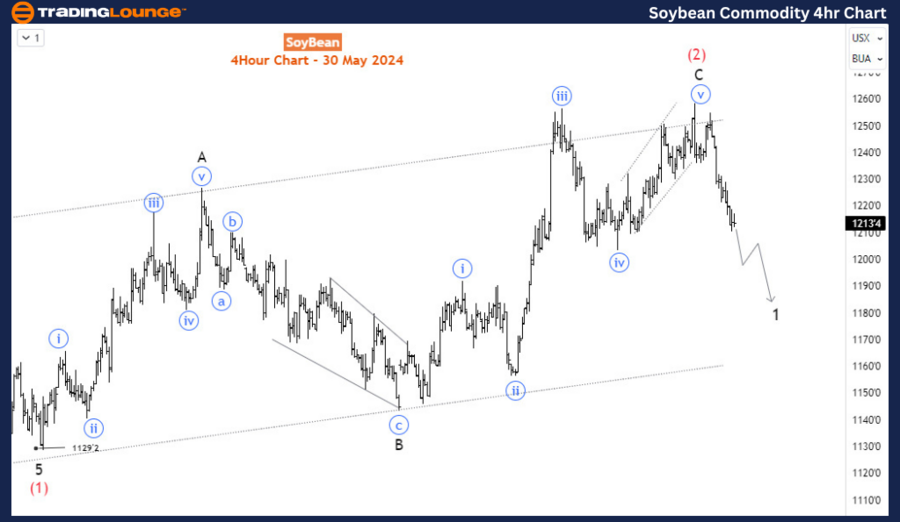
Soybeans H4 Chart Analysis

The H4 chart indicates that wave (2) was completed at 1258, and prices are moving downwards in wave 1 of (3) or blue wave 'a' of X in the case of a W-X-Y higher rally for wave (2). We should see the current decline complete at least a zigzag structure towards the 1190-1170 range in the coming days. Preferably, our primary count anticipates an impulse wave decline below 1129 for wave (3).

Technical Analyst: Sanmi Adeagbo

Source: visit Tradinglounge.com and learn From the Experts Join TradingLounge Here 

See Previous: Wheat Elliott Wave Analysis

Special Trial Offer - 0.76 Cents a Day for 3 Months! Click here

Access 7 Analysts Over 170 Markets Covered. Chat Room With Support

Soybeans-4hr-Commodi...

In summary, soybean prices are poised to continue their long-term bearish trend following the completion of a corrective structure that started in late February. The daily chart shows a well-defined bearish cycle from June 2022, with the recent corrective bounce forming wave (2). The H4 chart suggests that wave (2) ended at 1258, and we are now in wave 1 of (3) or in the early stages of blue wave 'a' of X, depending on the alternative scenario. Key levels to watch are 1190-1170 for a zigzag completion and 1129 for a potential impulse wave decline. Traders should prepare for a sell-off while remaining open to the possibility of a higher corrective rally if the double zigzag scenario plays out.

Related

Alphabet Inc. (GOOGL) Elliott Wave Analysis: Stock Forecast, Price Trends, and Investment Strategies for Better Trading Decisions

Alphabet Inc. (GOOGL) Elliott Wave Analysis: Stock Forecast, Price Trends, and Investment Strategies for Better Trading Decisions

Elliott Wave analysis of Alphabet Inc. (GOOGL), highlighting stock forecasts, potential resistance l...

Read More >
AUDJPY Elliott Wave Technical Analysis: Trading Signals, Support & Resistance Levels, and Price Predictions for Forex Traders

AUDJPY Elliott Wave Technical Analysis: Trading Signals, Support & Resistance Levels, and Price Predictions for Forex Traders

AUDJPY technical analysis explores the current market trend using Elliott Wave principles. It covers...

Read More >
RUSSELL 2000 Elliott Wave Technical Analysis: Identifying Key Market Trends and Forecasting Future Movements

RUSSELL 2000 Elliott Wave Technical Analysis: Identifying Key Market Trends and Forecasting Future Movements

The Russell 2000 Elliott Wave analysis with daily and weekly charts, A comprehensive look at the mar...

Read More >
Discover Commodity market trends with Our Coffee Elliott Wave Technical Analysis and Chart Insights

Discover Commodity market trends with Our Coffee Elliott Wave Technical Analysis and Chart Insights

Stay informed with our detailed coffee price analysis using Elliott Wave theory. Discover market tre...

Read More >
DIS Elliott Wave Analysis: Identifying Trading Opportunities for The Walt Disney Company (DIS)

DIS Elliott Wave Analysis: Identifying Trading Opportunities for The Walt Disney Company (DIS)

DIS Elliott Wave Analysis for The Walt Disney Company (DIS), reveals potential for both bullish and ...

Read More >
META's Stock Movements: Meta Platforms Inc. (META) Stocks Elliott Wave Technical Analysis

META's Stock Movements: Meta Platforms Inc. (META) Stocks Elliott Wave Technical Analysis

This article provides a detailed Elliott Wave analysis of Meta Platforms Inc. (META). It covers META...

Read More >

Buy 1 Month

Get 3 Months!

Special Offer:

Trade Recommendations

Unleash the power of deversified trading with our comprehensive portfolio, covering:

  • Stock Trades
  • Crypto Trades
  • Forex Trades
  • Commodity Trades
Elliott Wave Analysis

Gain a competive edge with expert insights in to:

  • Global Indices
  • US Stocks & ASX Stocks
  • Forex & Crypto
  • Commodities
Top-Notch Trading Tools

Equip yourself with the tools of success:

  • Social Chat
  • Elliott Wave Algorithm
  • Screener
  • TradingLevels
  • Trading Game
7 Elliott Wave Analysts

Stay ahead of the market with daily charts and insightful videos
-Your secret to strategic trading!

JOIN HERE


Welcome to TradingLounge (ASIC A.R.No. 321187), specialists in trades, trading education and technical analysis, covering stocks, indices, commodities, forex and cryptocurrencies.

When you join TradingLounge you have access to everything we offer, including trade tools, educational content and a social platform to chat with like-minded investors.

Read more

@Copyright 2024 by tradinglounge.com

Contact Us

Australian no: 02 4787 6020

International no: +61 (2) 47876020

Pay with:

Find us on