DOTUSD Elliott Wave Analysis – TradingLounge Daily Chart
Polkadot / U.S. Dollar (DOTUSD) Daily Chart Analysis
DOTUSD Elliott Wave Technical Analysis
Function: Follow Trend
Mode: Motive
Structure: Impulse
Position: Wave 2
Next Higher Degrees Direction: N/A
Invalidation Level: N/A
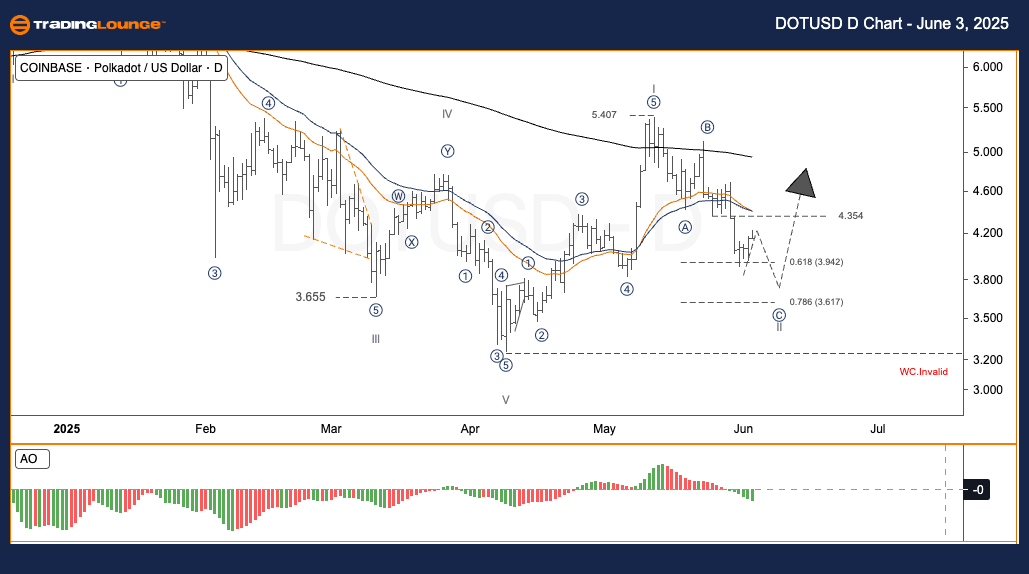
Polkadot Trading Strategy – Daily Chart
Polkadot (DOT) is currently correcting in a wave II structure, aligning with the Elliott Wave principle. Once this phase concludes, a wave III surge could emerge, often marked by strong upward momentum. The preceding wave I completed at $5.407, forming a well-defined five-wave pattern. Presently, wave II is unfolding as an ABC correction. Potential support and reversal zones for wave C include:
Fibonacci 0.618 retracement ≈ $3.94
Fibonacci 0.786 retracement ≈ $3.62
Suggested Strategies
✅ For Short-Term Traders (Swing Trade):
- Observe price action closely between $3.62 and $3.94.
- Confirm entry through bullish reversal candlestick patterns (e.g., Engulfing, Pin Bar).
🟥 Risk Management:
- Maintain a Stop Loss below $3.40 to manage invalidation risk in the wave count.
DOTUSD Elliott Wave Analysis – TradingLounge H4 Chart
Polkadot / U.S. Dollar (DOTUSD) 4-Hour Chart Analysis
DOTUSD Elliott Wave Technical Analysis
Function: Follow Trend
Mode: Motive
Structure: Impulse
Position: Wave 2
Next Higher Degrees Direction: N/A
Invalidation Level: N/A
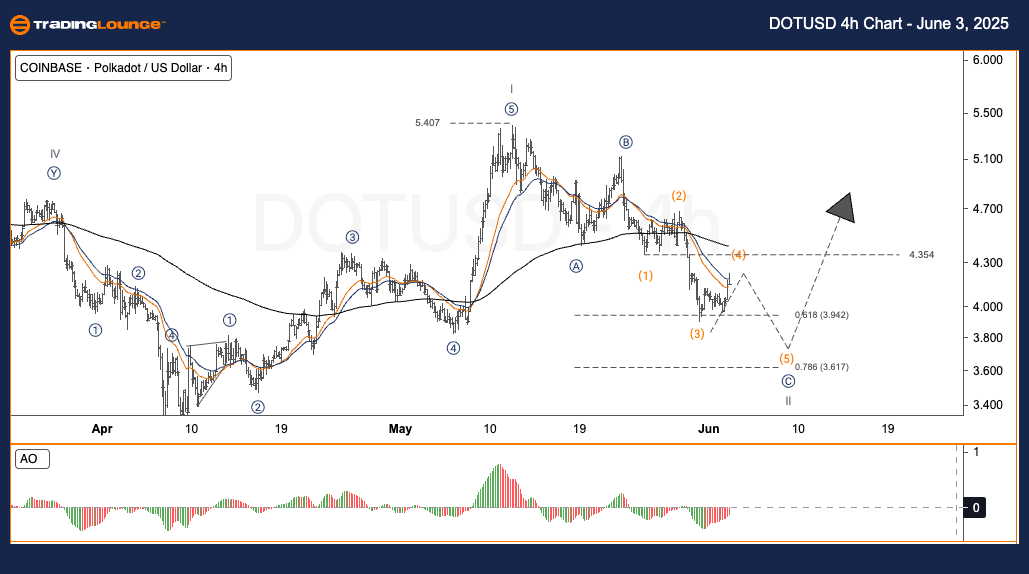
Polkadot Trading Strategy – H4 Chart
The 4-hour chart for Polkadot (DOT) also reflects a wave II corrective phase, preparing for a potential wave III advance. The initial bullish wave (Wave I) completed at $5.407 with five distinct internal legs. Currently, the market retraces via an ABC structure within wave II. Anticipated price targets for wave C include:
Fibonacci 0.618 retracement ≈ $3.94
Fibonacci 0.786 retracement ≈ $3.62
Suggested Strategies
✅ For Short-Term Traders (Swing Trade):
- Wait for a price test within the $3.62 to $3.94 range.
- Look for bullish reversal confirmation.
🟥 Risk Management:
- Suggested Stop Loss should be placed below $3.40 for protective coverage.
Technical Analyst: Malik Awais
Source: Visit Tradinglounge.com and learn from the Experts. Join TradingLounge Here
Previous: VETUSD Elliott Wave Technical Analysis
VALUE Offer - Buy 1 Month & Get 3 Months!Click here
Access 7 Analysts Over 200 Markets Covered. Chat Room With Support