10Feb

GBPUSD Elliott Wave Analysis: Forecast on Bullish Trend, Price Movement, and Key Support & Resistance Levels for Forex Traders

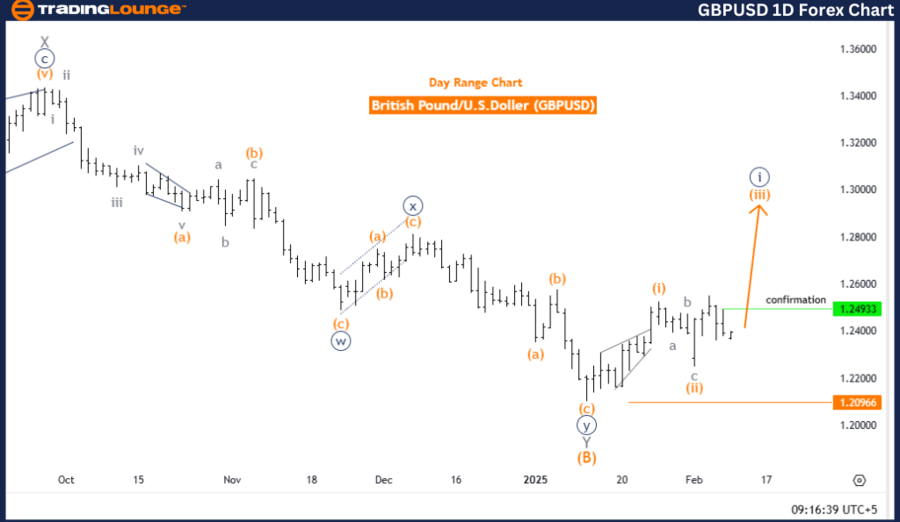
British Pound/ U.S. Dollar (GBPUSD) - TradingLounge Daily Chart

British Pound/ U.S. Dollar Currency Pair Daily Chart Analysis

GBPUSD Elliott Wave Technical Analysis

Function: Bullish Trend

Mode: Impulsive

Structure: Orange Wave 3

Position: Navy Blue Wave

Direction Next Lower Degrees: Orange Wave 4

Details: Orange Wave 2 of 3 appears completed; Orange Wave 3 is now in progress.

Wave Cancellation Invalidation Level: 1.20966

GBPUSD Forex Pair Analysis Overview

The GBPUSD Elliott Wave Analysis for the daily chart presents a bullish trend, driven by impulsive market movement. The price structure indicates that Orange Wave 3 is unfolding within the larger Navy Blue Wave, signaling strong upward momentum.

Wave Progression and Key Levels

  • The corrective phase of Orange Wave 2 seems to have ended, paving the way for the continuation of Orange Wave 3.

  • Once Orange Wave 3 concludes, a corrective pullback (Orange Wave 4) may follow.
  • Key Invalidation Level: If the price drops below 1.20966, the current wave count will be invalidated, potentially altering the bullish scenario.

Summary

The GBPUSD daily chart analysis confirms a bullish Elliott Wave structure, with the pair progressing in Orange Wave 3 within the Navy Blue Wave. The recent completion of Orange Wave 2 supports further upside movement.

📌 Key Takeaways:
Bullish momentum remains intact as long as the price stays above 1.20966.
Orange Wave 3 is expected to push the price higher, followed by Orange Wave 4 as a correction.
✔ This structure provides traders with a roadmap to navigate potential price movements.

GBPUSD-1D-Forex-Char...


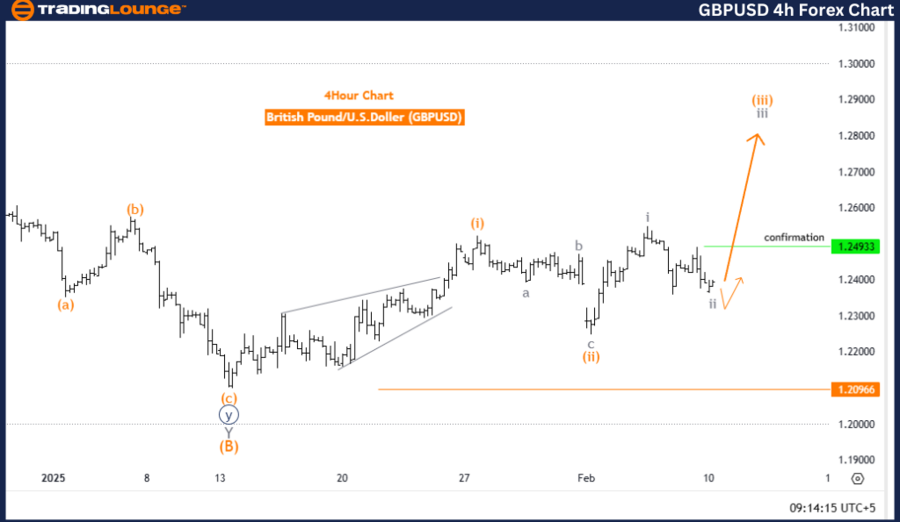
British Pound/ U.S. Dollar (GBPUSD) - 4-Hour Chart

GBPUSD Elliott Wave Technical Analysis

Function: Bullish Trend

Mode: Impulsive

Structure: Gray Wave 3

Position: Orange Wave 3

Direction Next Higher Degrees: Gray Wave 3 (Started)

Details: Gray Wave 2 of Orange Wave 3 appears completed; Gray Wave 3 is now in progress.

Wave Cancellation Invalidation Level: 1.20966

GBPUSD Currency Analysis Overview

The GBPUSD Elliott Wave Analysis on the 4-hour chart indicates an ongoing bullish trend with an impulsive wave structure. The market is currently developing Gray Wave 3, which forms a segment of the broader Orange Wave 3, reinforcing the bullish sentiment.

Wave Progression and Key Levels

  • Gray Wave 2 appears to have completed its corrective cycle, signaling the beginning of Gray Wave 3, which is expected to push prices higher.

  • The next wave progression at a higher degree confirms continued bullish movement with Gray Wave 3 unfolding.
  • Key Invalidation Level: A price dip below 1.20966 would invalidate the current bullish wave structure.

Summary

The GBPUSD 4-hour chart analysis suggests that the currency pair remains in a strong bullish phase, progressing through Gray Wave 3 of Orange Wave 3.

📌 Key Takeaways:
✔ The bullish trend remains intact unless the price drops below 1.20966.
Gray Wave 3 is expected to continue pushing the price higher, confirming strong momentum.
✔ This analysis offers traders a structured outlook to anticipate future price movements.

Technical Analyst: Malik Awais

Source: visit Tradinglounge.com and learn From the Experts Join TradingLounge Here 

Previous: USDCHF Elliott Wave Technical Analysis

VALUE Offer - Buy 1 Month & Get 3 Months!Click here

Access 7 Analysts Over 200 Markets Covered. Chat Room With Support

GBPUSD-4h-Forex-Char...

Related

Polkadot Forecast and DOTUSD Elliott Wave Analysis, Confirming Bullish Breakout and Trend Continuation from Fibonacci Zone

Polkadot Forecast and DOTUSD Elliott Wave Analysis, Confirming Bullish Breakout and Trend Continuation from Fibonacci Zone

Polkadot (DOT) is showing bullish momentum, entering wave 3 after a Zigzag correction. Elliott Wave ...

Read More >
Navigating Uptrend Opportunities: Theta Token/ U.S. dollar(THETAUSD) Elliott Wave Analysis

Navigating Uptrend Opportunities: Theta Token/ U.S. dollar(THETAUSD) Elliott Wave Analysis

Our Elliott Wave analysis of THETAUSD suggests a bullish outlook as of February 20, 2024. Both daily...

Read More >
Ripple (XRPUSD) Elliott Wave Wave 3 Breakout Above $2.30 Guides Swing Trade Entry & Stop‑Loss Strategy Summary

Ripple (XRPUSD) Elliott Wave Wave 3 Breakout Above $2.30 Guides Swing Trade Entry & Stop‑Loss Strategy Summary

Elliott Wave analysis shows XRPUSD entering wave 3 after breaking $2.30. Includes swing trade strate...

Read More >
Comprehensive Insights on ASX LIMITED - ASX Stock Analysis & Elliott Wave Technical Forecast

Comprehensive Insights on ASX LIMITED - ASX Stock Analysis & Elliott Wave Technical Forecast

Stay updated with comprehensive insights on ASX Limited stock. Explore the current stock price, deta...

Read More >
U.S.Dollar /Canadian Dollar(USD/CAD) Elliott Wave Technical Analysis 29 November 23

U.S.Dollar /Canadian Dollar(USD/CAD) Elliott Wave Technical Analysis 29 November 23

USD and CAD Elliott Wave Analysis Trading Lounge Day Chart dated 29 November 23, delves into a detai...

Read More >
New Zealand Dollar/U.S.Dollar(NZDUSD) Elliott Wave Technical Analysis 25 January 24

New Zealand Dollar/U.S.Dollar(NZDUSD) Elliott Wave Technical Analysis 25 January 24

The NZDUSD Elliott Wave Technical Analysis for the Day and 4-hour Chart on 25 January 24, provides a...

Read More >

$1 for 2 Weeks

then $29 a month!

What a Special Offer!

Trade Recommendations

Unleash the power of deversified trading with our comprehensive portfolio, covering 250+ markets:

  • Stock Trades
  • Crypto Trades
  • Forex Trades
  • Commodity Trades
Elliott Wave Analysis

Gain a competitive edge with expert insights and AI-powered Elliott Wave charting into:

  • Global Indices
  • US Stocks & ASX Stocks
  • Forex & Crypto
  • Commodities
Top-Notch Trading Tools

Equip yourself with the tools of success:

  • Real-time Chat rooms
  • Elliott Wave Algorithm
  • Portfolio tools
  • TradingLevels
  • Screener
  • Trading Game
7 Elliott Wave Analysts

Stay ahead of the market with daily charts and insightful videos
Your secret to strategic trading!

JOIN HERE


Welcome to TradingLounge (ASIC A.R.No. 321187), specialists in trades, trading education and technical analysis, covering stocks, indices, commodities, forex and cryptocurrencies.

When you join TradingLounge you have access to everything we offer, including trade tools, educational content and a social platform to chat with like-minded investors.

Read more

@Copyright 2024 by tradinglounge.com

Contact Us

Australian no: 02 4787 6020

International no: +61 (2) 47876020

Pay with:

Find us on