USD/CAD Elliott Wave Analysis Trading Lounge Day Chart,
U.S.Dollar /Canadian Dollar(USD/CAD) Day Chart Analysis
USD/CAD Elliott Wave Technical Analysis
FUNCTION: Trend
MODE: impulsive
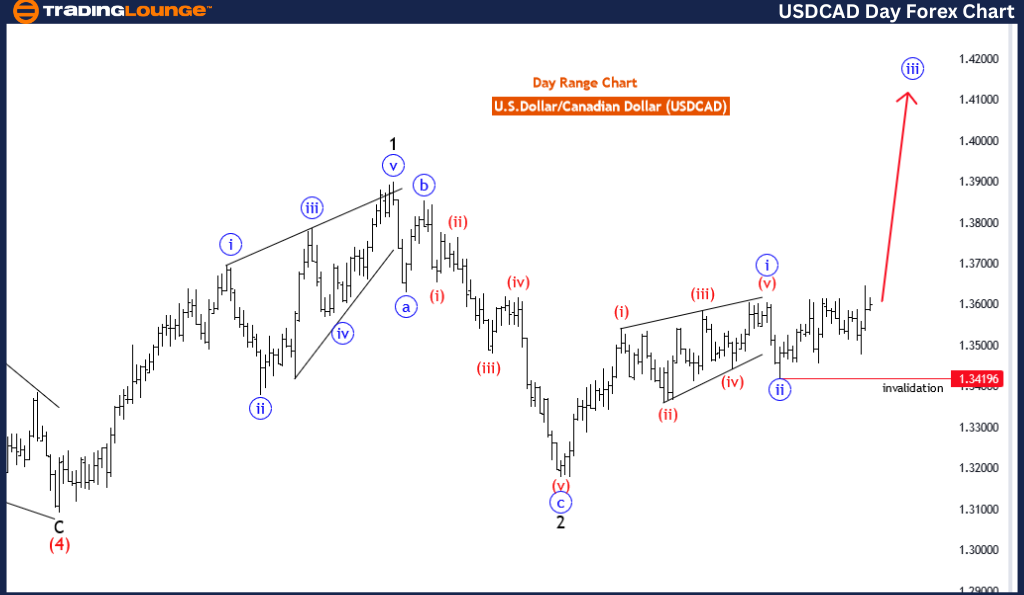
STRUCTURE: blue wave 3
POSITION: black wave 3
DIRECTION NEXT LOWER DEGREES: blue wave 4
DETAILS: Blue Wave 2 was completed at 1.34196, and now Blue Wave 3 is in play. Wave Cancel invalid level:1.34196
The USD/CAD Elliott Wave Analysis for the day chart provides traders with a comprehensive view of the potential price movements of the US Dollar against the Canadian Dollar, employing Elliott Wave principles for technical analysis.
Identified as a "Trend" scenario, the analysis suggests that the prevailing market direction favours an uptrend in the USD/CAD pair. This indicates that traders may anticipate further strengthening of the US Dollar relative to the Canadian Dollar.
Characterized as "Impulsive" in mode, the analysis indicates that the current market movement displays characteristics of impulsiveness, suggesting a strong and sustained buying momentum that is propelling the price higher. This implies that the ongoing uptrend in the USD/CAD pair is driven by significant buying activity.
The "STRUCTURE" is identified as "Blue wave 3," providing clarity on the current wave count within the Elliott Wave cycle. This assists traders in understanding the ongoing bullish momentum and its alignment with the broader Elliott Wave structure.
Positioned as "Black Wave 3," the analysis highlights the current wave count within the larger Elliott Wave cycle, indicating the specific phase of the bullish trend. This suggests that the market is currently experiencing a significant upward movement within the broader wave structure.
The "DIRECTION NEXT LOWER DEGREES" is denoted as "Blue wave 4," implying the anticipated direction for the subsequent lower-degree wave. This indicates that following the completion of the current bullish wave, a corrective phase may ensue before a potential continuation of the uptrend.
In the "DETAILS" section, it is mentioned that "Blue wave 2 completed at 1.34196, now blue wave 3 is in play." This signifies that the corrective phase of the Elliott Wave cycle has concluded, and the market is now poised for a new impulsive movement in the direction of the trend. The "Wave Cancel invalid level" at 1.34196 serves as a reference point for traders to monitor potential invalidation of the current wave count.
CAD Elliott Wave Analysis Trading Lounge 4-Hour Chart,
U.S.Dollar /Canadian Dollar(USD/CAD) 4 Hour Chart Analysis
USD/CAD Elliott Wave Technical Analysis
FUNCTION: Trend
MODE: impulsive
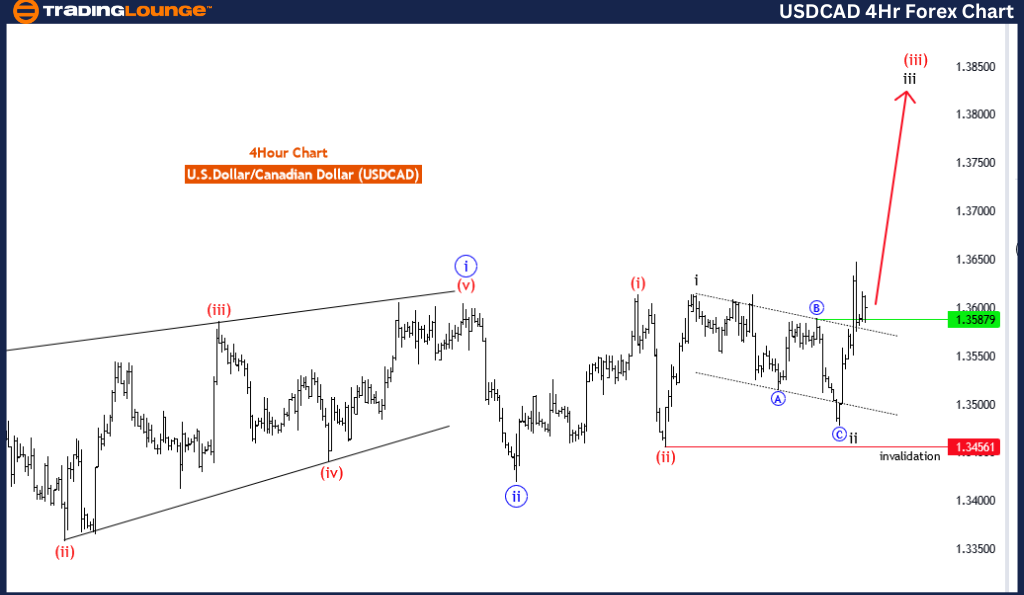
STRUCTURE: black wave 3
POSITION: Red wave 3
DIRECTION NEXT LOWER DEGREES: black wave 4
DETAILS: black wave 2 of 3 completed, now black wave 3 is in play. Wave Cancel invalid level:1.34561
The USD/CAD Elliott Wave Analysis for the day chart provides traders with insights into potential price movements of the US Dollar against the Canadian Dollar, employing Elliott Wave principles for technical analysis.
Identified as a "Trend" scenario, the analysis suggests that the current market direction aligns with the prevailing trend, indicating a potential continuation of the upward movement. This implies that traders may anticipate further appreciation of the US Dollar relative to the Canadian Dollar.
Described as "Impulsive" in mode, the analysis indicates that the current market movement exhibits characteristics of impulsiveness, suggesting strong and sustained buying pressure driving the price higher. This implies that the current uptrend may be driven by significant buying interest in the USD/CAD pair.
The "STRUCTURE" is identified as "Black Wave 3," providing clarity on the current wave count within the Elliott Wave cycle. This aids traders in understanding the ongoing bullish momentum and its relation to the broader Elliott Wave structure.
Positioned as "Red wave 3," the analysis highlights the current wave count within the broader Elliott Wave cycle, indicating the specific phase of the bullish trend. This suggests that the market is currently in the midst of a significant upward movement within the larger wave structure.
The "DIRECTION NEXT LOWER DEGREES" is stated as "Black wave 4," suggesting the anticipated direction for the subsequent lower-degree wave. This implies that after the completion of the current bullish wave, a corrective phase may follow before a potential continuation of the uptrend.
In the "DETAILS" section, it is noted that "Black wave 2 of 3 completed, now Black wave 3 is in play." This indicates that the corrective phase following the completion of Black Wave 2 has ended, and the market is now in the process of resuming the bullish trend.
The "Wave Cancel invalid level" is specified as 1.34561, serving as a critical level that, if breached, may invalidate the current wave count and require a reassessment of the analysis.
In summary, the USD/CAD Elliott Wave Analysis for the day chart provides traders with valuable insights into potential bullish movements, critical levels to monitor, and the anticipated direction within the broader Elliott Wave structure, aiding in informed trading decisions.
Technical Analyst: Malik Awais
Source: visit Tradinglounge.com and learn From the Experts Join TradingLounge Here
See Previous: British Pound/ Australian Dollar(GBPAUD)
TradingLounge Once Off SPECIAL DEAL: Here > 1 month Get 3 months.
TradingLounge's Free Week Extravaganza!
April 14 – 21: Unlock the Doors to Trading Excellence — Absolutely FREE