CSX Elliott Wave Analysis | Trading Lounge Daily Chart
CSX Corp. (CSX) Daily Chart Analysis
CSX Elliott Wave Technical Forecast
FUNCTION: Trend
MODE: Impulsive
STRUCTURE: Motive
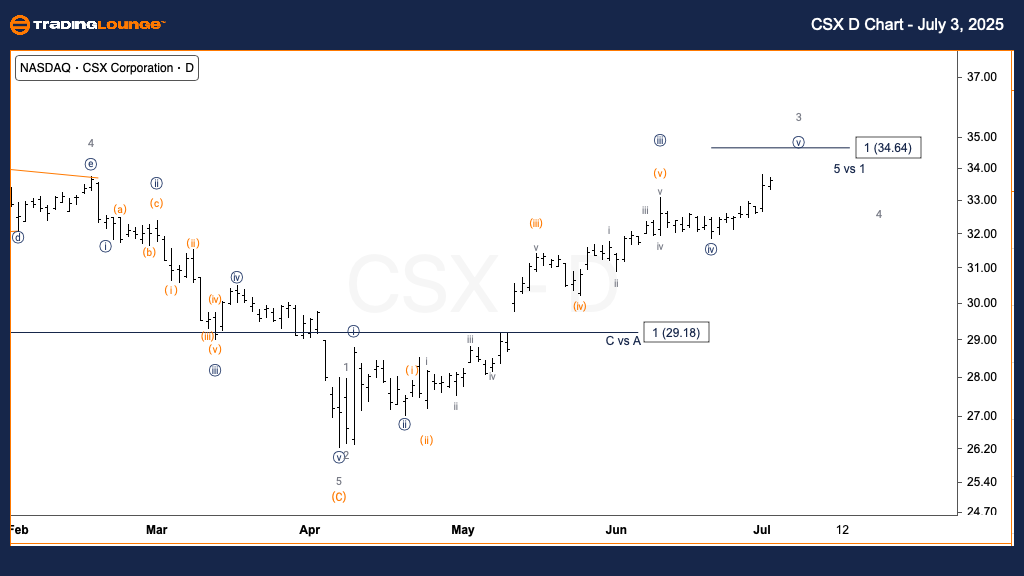
POSITION: Wave {v} of 3
DIRECTION: Bullish trend in wave {v}
DETAILS: Forecasting continued upward movement in wave {v} of 3, targeting resistance near $35, based on wave {i} projection.
CSX Corp. (CSX) 1-Hour Chart Analysis
CSX Elliott Wave Technical Forecast
FUNCTION: Trend
MODE: Impulsive
STRUCTURE: Motive
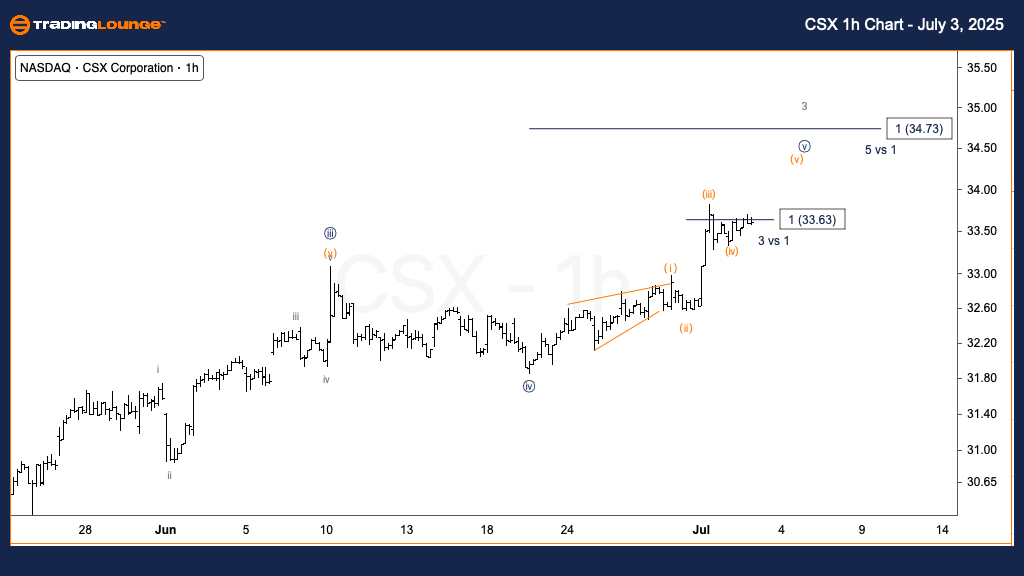
POSITION: Wave (iv) of {v}
DIRECTION: Upward movement in wave (v)
DETAILS: Expecting a final bullish leg in wave (v); potential for an extended move higher as wave (iii) surpassed wave (i) magnitude.
Technical Analyst: Alessio Barretta
Visit: TradingLounge.com for detailed analysis and market updates.
Previous: MARA Holdings, Inc (MARA) Elliott Wave Technical Analysis
VALUE Offer - $1 for 2 Weeks then $29 a month!Click here
Access 7 Analysts Over 200 Markets Covered. Chat Room With Support
CSX Daily Chart – Elliott Wave Analysis Summary
The daily Elliott Wave chart for CSX Corp. (NASDAQ: CSX) shows strong bullish momentum continuing in wave {v} of the larger wave 3. This move is aimed toward the $35 price target, which aligns with wave {i}'s range. The impulsive wave structure supports a motive wave pattern, often signaling further upside. Wave {v} commonly completes the third wave in the Elliott Wave sequence, typically representing the most robust phase in a bullish trend.
CSX 1-Hour Chart – Elliott Wave Update
On the 1-hour timeframe, CSX appears to be finishing wave (iv) within the ongoing wave {v}. A final upward push in wave (v) is anticipated, potentially taking the stock above key resistance. Since wave (iii) extended beyond wave (i), there is room for wave (v) to stretch further, continuing CSX’s short-term bullish trajectory and possibly surpassing the $35 mark.