JP Morgan Chase & Co. (JPM) Elliott Wave Technical Analysis - Daily and 1h
JPM Elliott Wave Analysis – Tradinglounge Daily Chart
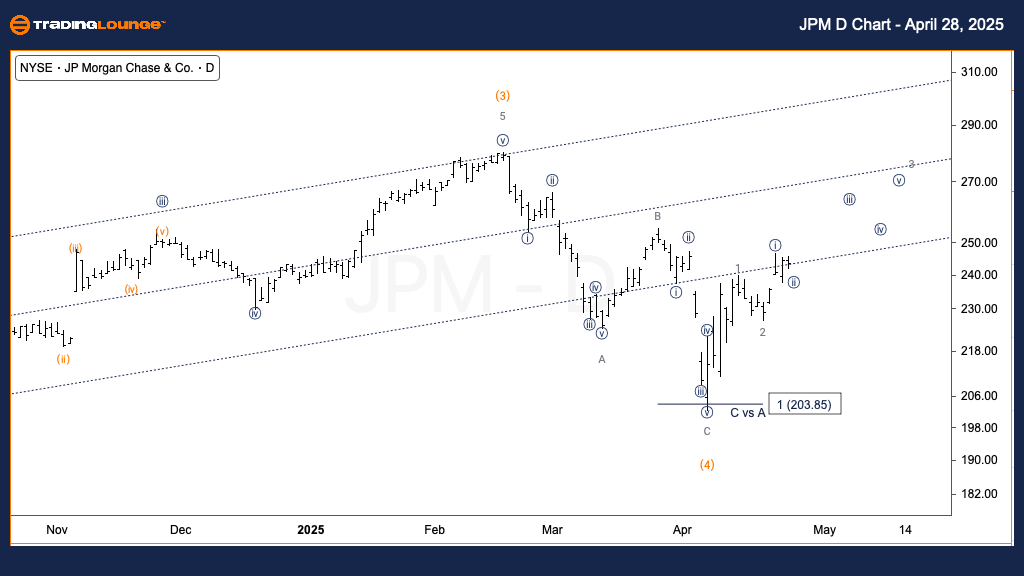
JP Morgan & Chase Co. (JPM) U.S. Stocks Daily Chart Analysis
Function: Trend
Mode: Impulsive
Structure: Motive
Position: Wave 3
Direction: Upside in Wave 3
Details:
JP Morgan Chase & Co. (JPM) has likely completed wave 2, opening the way for further gains within wave 3 of Primary wave (5). The Elliott Wave forecast targets the next key resistance at TradingLevel3, around $300. As wave 3 extends higher, strong bullish momentum is expected to continue, reinforcing the uptrend in JPM stock.
JPM Elliott Wave Analysis – Tradinglounge 1-Hour Chart
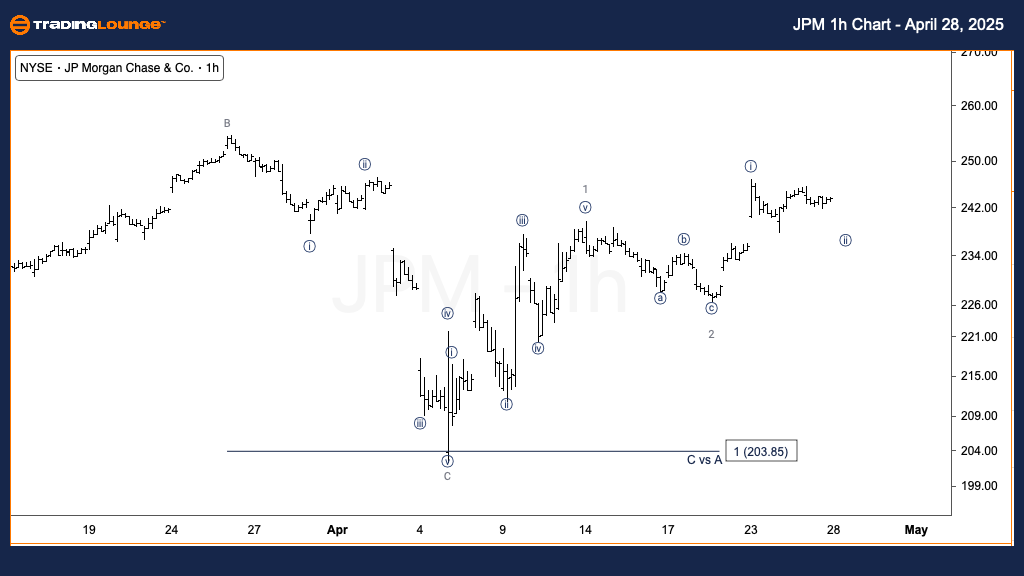
JP Morgan & Chase Co. (JPM) U.S. Stocks Daily Chart Analysis
Function: Trend
Mode: Impulsive
Structure: Motive
Position: Wave {ii} of 3
Direction: Bottom in Wave {ii}
Details:
On the 1-hour timeframe, JP Morgan Chase & Co. (JPM) is close to completing wave {ii} of 3, setting up for a powerful third-of-a-third wave rally. Alternatively, there’s a slight chance that JPM is in wave (iv) of {i}. Nevertheless, the overall Elliott Wave structure remains bullish, supporting a strong upside breakout once the current correction ends.
Technical Analyst: Alessio Barretta
Source: Visit Tradinglounge.com and learn from the Experts. Join TradingLounge Here
Previous: Spotify Technology Elliott Wave Technical Analysis
VALUE Offer - Buy 1 Month & Get 3 Months!Click here
Access 7 Analysts Over 200 Markets Covered. Chat Room With Support
Market Summary
This updated Elliott Wave analysis for JP Morgan Chase & Co. (JPM) reviews both the daily and 1-hour charts, providing a technical forecast through the lens of Elliott Wave Theory. The analysis highlights a bullish outlook for JPM shares, while acknowledging minor alternate scenarios during short-term corrections.