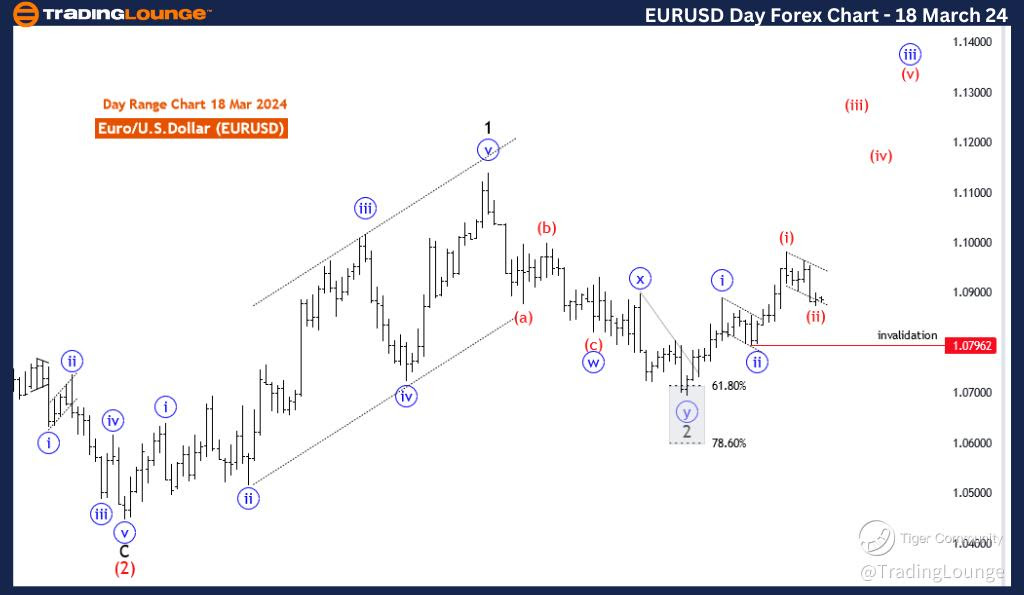
EURUSD Elliott Wave Analysis Trading Lounge Day Chart, 18 March 24
Euro/U.S.Dollar (EURUSD) Day Chart Analysis
EURUSD Elliott Wave Technical Analysis
FUNCTION: Trend
MODE: Impulsive
STRUCTURE: red wave 3
POSITION: Blue Wave 3
DIRECTION NEXT LOWER DEGREES: Red wave 4
DETAILS: Red wave 2 of 1 looks completed or near to end. Now Red Wave 3 of blue wave 3 may be in play. Wave Cancel invalid level: 1.07962
The EUR/USD Elliott Wave Analysis for the day chart on 18 March 24, provides insights into the potential price movements of the Euro/U.S. Dollar currency pair using Elliott Wave principles within technical analysis.
Identified as a "Trend" scenario, the analysis focuses on capturing and interpreting price movements in alignment with the prevailing direction, indicating a current trend in the pair.
Described as "Impulsive," the "MODE" indicates that the current price action exhibits characteristics of impulsive waves within Elliott Wave theory. Impulsive waves typically denote strong and directional movements in the market.
The "STRUCTURE" is labelled as "Red wave 3," suggesting the current phase within the broader Elliott Wave count. This implies that the market is currently experiencing a significant upward movement, likely the third wave within the larger Elliott Wave cycle.
Positioned as "Blue Wave 3," the analysis suggests that the current price movement is part of the third wave within the ongoing Elliott Wave count. This indicates that the market has advanced further within the current wave cycle, possibly signalling a continuation of the bullish trend.
The "DIRECTION NEXT LOWER DEGREES" is identified as "Red wave 4," indicating the anticipated direction for the subsequent lower-degree wave. This implies an expectation of a corrective phase following the completion of the current upward wave.
In the "DETAILS" section, it is mentioned that "Red wave 2 of 1 looking completed or near to end. Now Red wave 3 of blue wave 3 may be in play." This suggests that the previous corrective phase has either concluded or is nearing completion, with the market potentially entering a new impulsive phase.
The "Wave Cancel invalid level" is specified as 1.07962, serving as a critical threshold. A breach beyond this level would invalidate the current wave count, necessitating a reassessment of the analysis.
In summary, the EUR/USD Elliott Wave Analysis for the day chart on 18 March 24, suggests a trend scenario characterized by impulsive upward movements, with the market potentially entering the third wave of the ongoing cycle. The Wave Cancel invalid level provides a reference point for monitoring potential shifts in the wave count and trend dynamics.
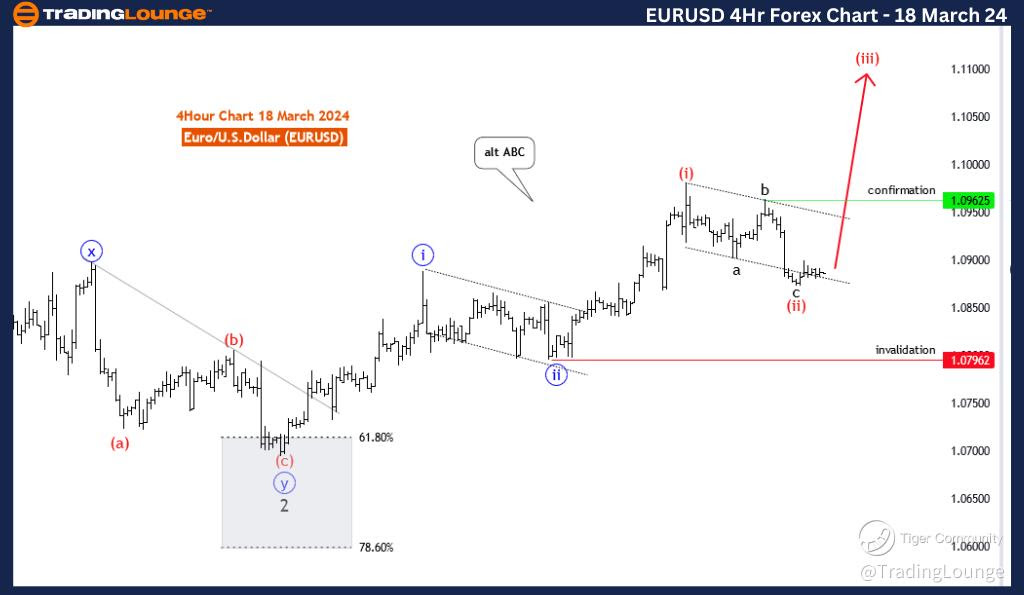
EURUSD Elliott Wave Analysis Trading Lounge 4 Hour Chart, 18 March 24
Euro/U.S.Dollar (EURUSD) 4 Hour Chart Analysis
EURUSD Elliott Wave Technical Analysis
FUNCTION: Trend
MODE: Impulsive
STRUCTURE: red wave 3
POSITION: Blue Wave 3
DIRECTION NEXT LOWER DEGREES: Red wave 4
DETAILS: Red wave 2 of 1 looks completed or near to end. Now Red Wave 3 of Blue Wave 3 may be in play. Wave Cancel invalid level: 1.07962
The EUR/USD Elliott Wave Analysis for the 4-hour chart on 18 March 24, provides insights into potential price movements in the Euro/U.S. Dollar currency pair, employing Elliott Wave principles within the realm of technical analysis.
Identified as a "Trend" scenario, the analysis underscores a focus on capturing and interpreting price movements in alignment with the prevailing direction, indicating a current trend in the pair.
Described as "Impulsive," the "MODE" indicates that the current price action exhibits characteristics of impulsive waves within Elliott Wave theory. Impulsive waves typically denote strong and directional movements in the market.
The "STRUCTURE" is labelled as "Red wave 3," suggesting the current phase within the broader Elliott Wave count. This implies that the market is currently experiencing a significant upward movement, likely the third wave within the larger Elliott Wave cycle.
Positioned as "Blue Wave 3," the analysis suggests that the current price movement is part of the third wave within the ongoing Elliott Wave count. This implies that the market has advanced further within the current wave cycle, possibly indicating a continuation of the bullish trend.
The "DIRECTION NEXT LOWER DEGREES" is identified as "Red wave 4," indicating the anticipated direction for the subsequent lower-degree wave. This implies an expectation of a corrective phase following the completion of the current upward wave.
In the "DETAILS" section, it is mentioned that "Red wave 2 of 1 looking completed or near to end. Now Red wave 3 of blue wave 3 may be in play." This suggests that the previous corrective phase has either concluded or is nearing completion, with the market potentially entering a new impulsive phase.
The "Wave Cancel invalid level" is specified as 1.07962, serving as a critical threshold. A breach beyond this level would invalidate the current wave count, necessitating a reassessment of the analysis.
In summary, the EUR/USD Elliott Wave Analysis for the 4-hour chart on 18 March 24, suggests a trend scenario characterized by impulsive upward movements, with the market potentially entering the third wave of the ongoing cycle. The Wave Cancel invalid level provides a reference point for monitoring potential shifts in the wave count and trend dynamics.
Technical Analyst: Malik Awais
Source: visit Tradinglounge.com and learn From the Experts Join TradingLounge Here
See Previous: Australian Dollar /Japanese Yen(AUDJPY)
TradingLounge Once Off SPECIAL DEAL: Here > 1 month Get 3 months.