Welcome to our latest Elliott Wave analysis for Analog Devices Inc. (ADI) as of June 5, 2024. This analysis provides an in-depth look at ADI's price movements using the Elliott Wave Theory, helping traders identify potential opportunities based on current trends and market structure. We will cover insights from both the daily and 4-hour charts to offer a comprehensive perspective on ADI's market behavior.

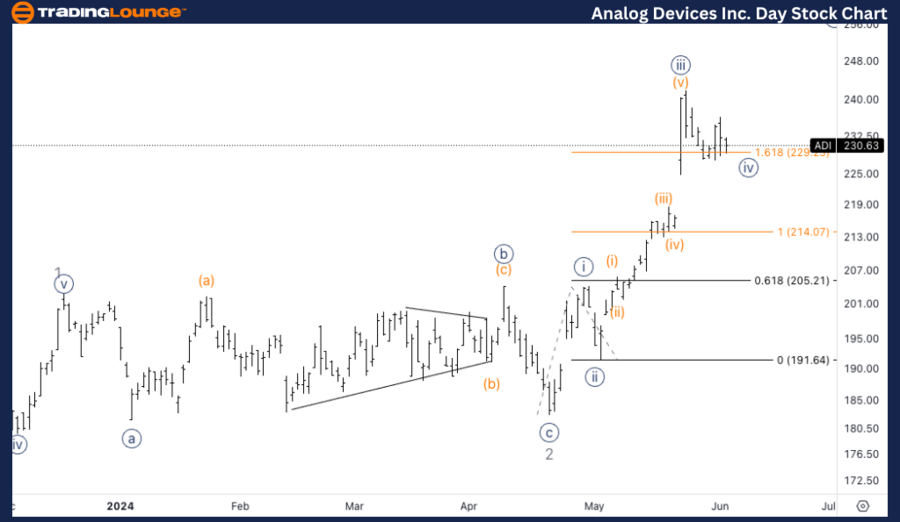
ADI Elliott Wave Analysis Trading Lounge Daily Chart

Analog Devices Inc. (ADI) Daily Chart Analysis

ADI Stock Technical Analysis

FUNCTION: Trend

MODE: Impulsive

STRUCTURE: Motive

POSITION: Minor 3

DIRECTION: Top in 3

DETAILS: We are looking at Minor Wave 3 unfolding nicely on the way up, and we are now finding support at the end of MG1 at $230 as we hit equality of 3 vs. 1.

ADI Elliott Wave Technical Analysis

In our Elliott Wave analysis of Analog Devices Inc. (ADI), we observe an impulsive trend characterized by a motive structure. ADI is currently positioned in Minor Wave 3, suggesting that this wave is unfolding nicely to the upside. We have identified support at the end of MG1 around $230, as the price reaches equality of wave 3 compared to wave 1. Traders should monitor this support level for signs of continuation higher, indicating the potential completion of Minor Wave 3.

Analog-Devices-Inc-D...


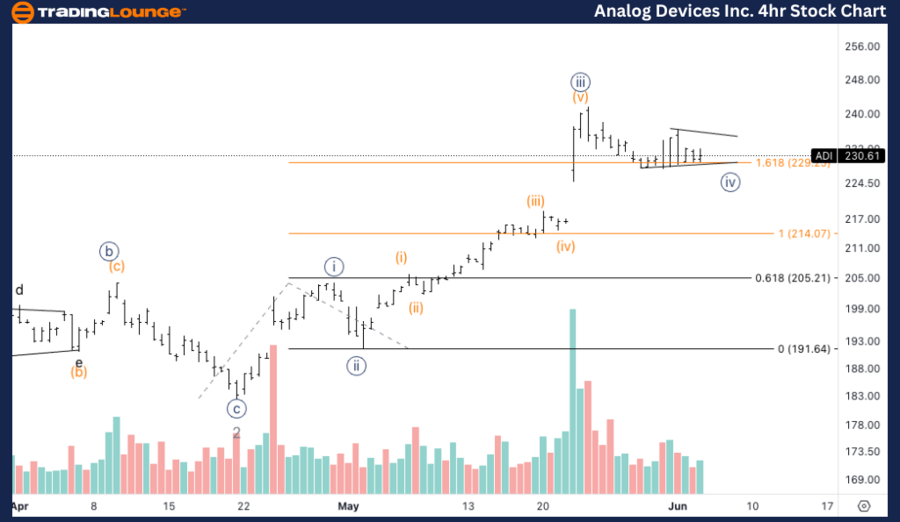
ADI Elliott Wave Analysis Trading Lounge 4Hr Chart

Analog Devises Inc. (ADI) 4Hr Chart Analysis

ADI Technical Analysis

FUNCTION: Trend

MODE: Impulsive

STRUCTURE: Motive

POSITION: Wave {iv} of 3

DIRECTION: Upside in {v}

DETAILS: Looking for sideways consolidation, potentially in a triangle, in wave {iv} to then continue higher towards Medium Level at $250.

ADI Elliott Wave Technical Analysis

On the 4-hour chart, ADI is following an impulsive trend within a motive structure, specifically in wave {iv} of 3. The current analysis indicates a potential sideways consolidation, possibly forming a triangle in wave {iv}, before continuing higher in wave {v}. The next key target for this upward movement is the Medium Level at $250. Traders should look for consolidation patterns and confirmation signals to position themselves for the anticipated upward move.

Technical Analyst: Alessio Barretta

Source: visit Tradinglounge.com and learn From the Experts Join TradingLounge Here 

See Previous: MicroStrategy Inc. (MSTR) Elliott Wave Technical Analysis

Special Trial Offer - 0.76 Cents a Day for 3 Months! Click here

Access 7 Analysts Over 170 Markets Covered. Chat Room With Support

Analog-Devices-Inc-4...

Related

Mahindra & Mahindra Stock Analysis: Elliott Wave Forecast Reveals Bullish Trend, Critical Support Levels, and Upcoming Price Movements

Mahindra & Mahindra Stock Analysis: Elliott Wave Forecast Reveals Bullish Trend, Critical Support Levels, and Upcoming Price Movements

Mahindra & Mahindra stock analysis uses Elliott Wave patterns to forecast bullish trends, key suppor...

Read More >
NIFTY 50 (INDIA) Index Elliott Wave Technical Analysis: Daily & Weekly Market Trends and Forecasts

NIFTY 50 (INDIA) Index Elliott Wave Technical Analysis: Daily & Weekly Market Trends and Forecasts

This analysis provides a comprehensive view of NIFTY 50 using Elliott Wave theory. Covering both dai...

Read More >
Elliott Wave Analysis: S&P 500, NASDAQ 100, DAX 40, FTSE 100, ASX200 Trading Strategies

Elliott Wave Analysis: S&P 500, NASDAQ 100, DAX 40, FTSE 100, ASX200 Trading Strategies

Stock Market Report S&P 500 - NASDAQ 100 - RUSSELL 2000 - DAX 40 - FTSE 100 - ASX 200. Elliott Wave ...

Read More >
INSURANCE AUSTRALIA GROUP LIMITED (IAG) Elliott Wave Analysis: Price Levels & Market Trends for Smarter Trading Decisions

INSURANCE AUSTRALIA GROUP LIMITED (IAG) Elliott Wave Analysis: Price Levels & Market Trends for Smarter Trading Decisions

Elliott Wave technical analysis for ASX: IAG (Insurance Australia Group Limited) provides a detailed...

Read More >
TITAN COMPANY Stock Elliott Wave Technical Analysis: Stock Currently Progressing within a Corrective Wave Structure

TITAN COMPANY Stock Elliott Wave Technical Analysis: Stock Currently Progressing within a Corrective Wave Structure

This article provides an in-depth Elliott Wave analysis of TITAN Company stock, including detailed f...

Read More >

$1 for 2 Weeks

then $29 a month!

What a Special Offer!

Trade Recommendations

Unleash the power of deversified trading with our comprehensive portfolio, covering 250+ markets:

  • Stock Trades
  • Crypto Trades
  • Forex Trades
  • Commodity Trades
Elliott Wave Analysis

Gain a competitive edge with expert insights and AI-powered Elliott Wave charting into:

  • Global Indices
  • US Stocks & ASX Stocks
  • Forex & Crypto
  • Commodities
Top-Notch Trading Tools

Equip yourself with the tools of success:

  • Real-time Chat rooms
  • Elliott Wave Algorithm
  • Portfolio tools
  • TradingLevels
  • Screener
  • Trading Game
7 Elliott Wave Analysts

Stay ahead of the market with daily charts and insightful videos
Your secret to strategic trading!

JOIN HERE


Welcome to TradingLounge (ASIC A.R.No. 321187), specialists in trades, trading education and technical analysis, covering stocks, indices, commodities, forex and cryptocurrencies.

When you join TradingLounge you have access to everything we offer, including trade tools, educational content and a social platform to chat with like-minded investors.

Read more

@Copyright 2024 by tradinglounge.com

Contact Us

Australian no: 02 4787 6020

International no: +61 (2) 47876020

Pay with:

Find us on