Welcome to our comprehensive Elliott Wave analysis for MicroStrategy Inc. (MSTR) as of June 4, 2024. This detailed examination uses Elliott Wave Theory to analyze MSTR's price movements, helping traders identify potential trading opportunities based on current trends and market structures. We provide insights from both the daily and 4-hour charts to give a thorough understanding of MSTR's market behaviour.

MSTR Elliott Wave Analysis - Trading Lounge Daily Chart

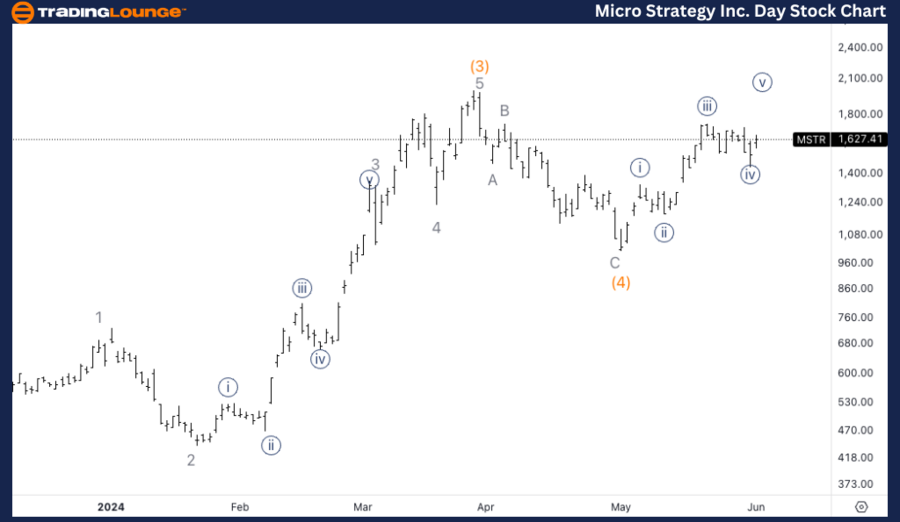
MicroStrategy Inc. (MSTR) Daily Chart Analysis

MSTR Elliott Wave Technical Analysis

Function: Trend

Mode: Impulsive

Structure: Motive

Position: Minor wave 1

Direction: Top in Minor wave 1

Details: We are looking for a top in either Minor wave 1 or Intermediate wave (5).

Micro-Strategy-Inc-D...


MSTR Elliott Wave Analysis - Trading Lounge 4-Hour Chart

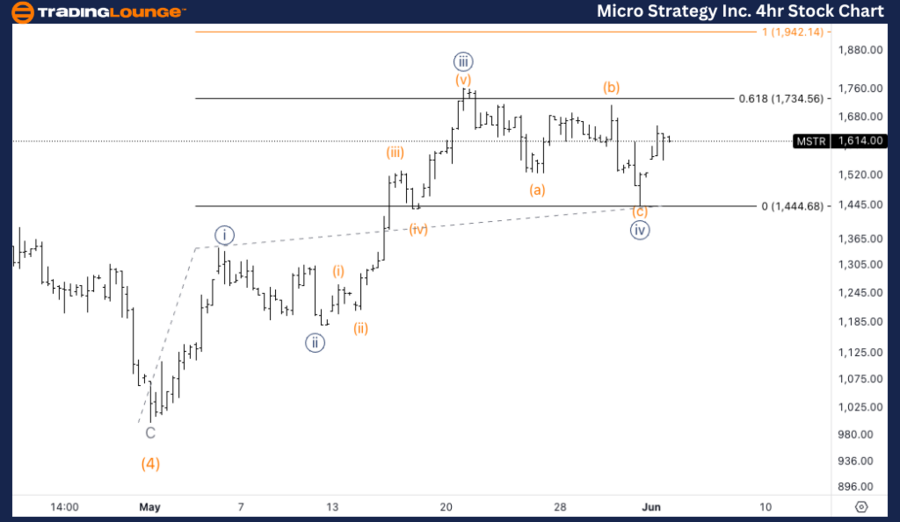
MicroStrategy Inc. (MSTR) 4-Hour Chart Analysis

MSTR Elliott Wave Technical Analysis

Function: Trend

Mode: Impulsive

Structure: Motive

Position: Wave {v} of 5

Direction: Upside in wave {v}

Details: We anticipate an upside move into wave {v}, with confirmation at the break of the previous Minuette wave (b). The equality of wave {v} versus wave {i} is projected at $1940.

Technical Analyst: Alessio Barretta

Source: visit Tradinglounge.com and learn From the Experts Join TradingLounge Here 

See Previous: Exxon Mobil Inc. (XOM) Elliott Wave Technical Analysis

Special Trial Offer - 0.76 Cents a Day for 3 Months! Click here

Access 7 Analysts Over 170 Markets Covered. Chat Room With Support

Micro-Strategy-Inc-W...

Conclusion:

Our Elliott Wave analysis for MicroStrategy Inc. (MSTR) as of June 4, 2024, provides traders with a thorough examination of MSTR's price movements and potential trading opportunities. By analyzing both the daily and 4-hour charts, we offer valuable insights into the current trends and market structures, helping traders make informed decisions. Keep an eye on the projected tops in Minor wave 1 and Intermediate wave (5), as well as the anticipated upside move in wave {v}, with key confirmation levels to watch. This comprehensive analysis aims to support your trading strategy and enhance your understanding of MSTR's market behavior.

Related

U.S.Dollar/Japanese Yen (USDJPY) Elliott Wave Technical Analysis 29 January 24

U.S.Dollar/Japanese Yen (USDJPY) Elliott Wave Technical Analysis 29 January 24

The USDJPY Elliott Wave Analysis dated 29 January 24, provides a comprehensive examination of the U....

Read More >
Elliott Wave analysis of Commonwealth Bank of Australia (CBA) Stock Provides Insights into the Current Market trends on the ASX

Elliott Wave analysis of Commonwealth Bank of Australia (CBA) Stock Provides Insights into the Current Market trends on the ASX

This comprehensive Elliott Wave analysis of Commonwealth Bank of Australia (CBA) stock provides insi...

Read More >
In-Depth Elliott Wave Forecast and Technical Analysis for NAB on the Australian Stock Exchange (ASX)

In-Depth Elliott Wave Forecast and Technical Analysis for NAB on the Australian Stock Exchange (ASX)

Our comprehensive Elliott Wave analysis of ASX: NATIONAL AUSTRALIA BANK LIMITED (NAB) provides trade...

Read More >
"Comprehensive Commodity Market Elliott Wave Analysis: Bitcoin, ETH/USD, Gold, Silver, and More"

"Comprehensive Commodity Market Elliott Wave Analysis: Bitcoin, ETH/USD, Gold, Silver, and More"

Commodity Market Elliott Wave Analysis Summary - Bitcoin (BTC) and ETH/USD: Tracking Wave v) of 1 o...

Read More >
QUALCOMM Inc. (QCOM) Stocks Elliott Wave Technical Analysis: Monitor Key Levels to identify Potential Entry and Exit Points

QUALCOMM Inc. (QCOM) Stocks Elliott Wave Technical Analysis: Monitor Key Levels to identify Potential Entry and Exit Points

This QCOM Elliott Wave analysis provides traders with insights into QUALCOMM's stock forecast, p...

Read More >
Mahindra & Mahindra Stock Analysis: Elliott Wave Forecast Reveals Bullish Trend, Critical Support Levels, and Upcoming Price Movements

Mahindra & Mahindra Stock Analysis: Elliott Wave Forecast Reveals Bullish Trend, Critical Support Levels, and Upcoming Price Movements

Mahindra & Mahindra stock analysis uses Elliott Wave patterns to forecast bullish trends, key suppor...

Read More >

$1 for 2 Weeks

then $29 a month!

What a Special Offer!

Trade Recommendations

Unleash the power of deversified trading with our comprehensive portfolio, covering 250+ markets:

  • Stock Trades
  • Crypto Trades
  • Forex Trades
  • Commodity Trades
Elliott Wave Analysis

Gain a competitive edge with expert insights and AI-powered Elliott Wave charting into:

  • Global Indices
  • US Stocks & ASX Stocks
  • Forex & Crypto
  • Commodities
Top-Notch Trading Tools

Equip yourself with the tools of success:

  • Real-time Chat rooms
  • Elliott Wave Algorithm
  • Portfolio tools
  • TradingLevels
  • Screener
  • Trading Game
7 Elliott Wave Analysts

Stay ahead of the market with daily charts and insightful videos
Your secret to strategic trading!

JOIN HERE


Welcome to TradingLounge (ASIC A.R.No. 321187), specialists in trades, trading education and technical analysis, covering stocks, indices, commodities, forex and cryptocurrencies.

When you join TradingLounge you have access to everything we offer, including trade tools, educational content and a social platform to chat with like-minded investors.

Read more

@Copyright 2024 by tradinglounge.com

Contact Us

Australian no: 02 4787 6020

International no: +61 (2) 47876020

Pay with:

Find us on