The Walt Disney Co. (DIS) Elliott Wave Analysis – Trading Lounge Daily Chart Analysis
DIS Elliott Wave Technical Overview
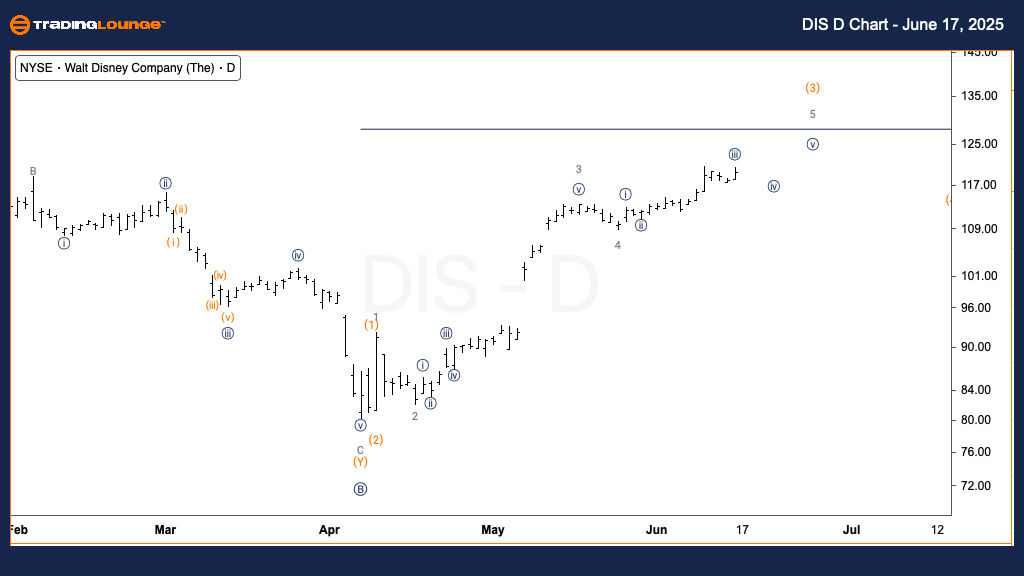
Function: Trend
Mode: Impulsive
Structure: Motive
Position: Wave (3) of C
Direction: Uptrend in wave (3)
Details: Current Elliott Wave analysis for Disney (DIS) shows ongoing upward movement within wave (3) of a motive pattern. Bullish momentum continues, with prices likely advancing toward the peak of Minor Group 1. This supports a positive outlook for further growth.
The Walt Disney Co. (DIS) Elliott Wave Analysis – Trading Lounge 1H Chart Analysis
DIS Elliott Wave Technical Overview
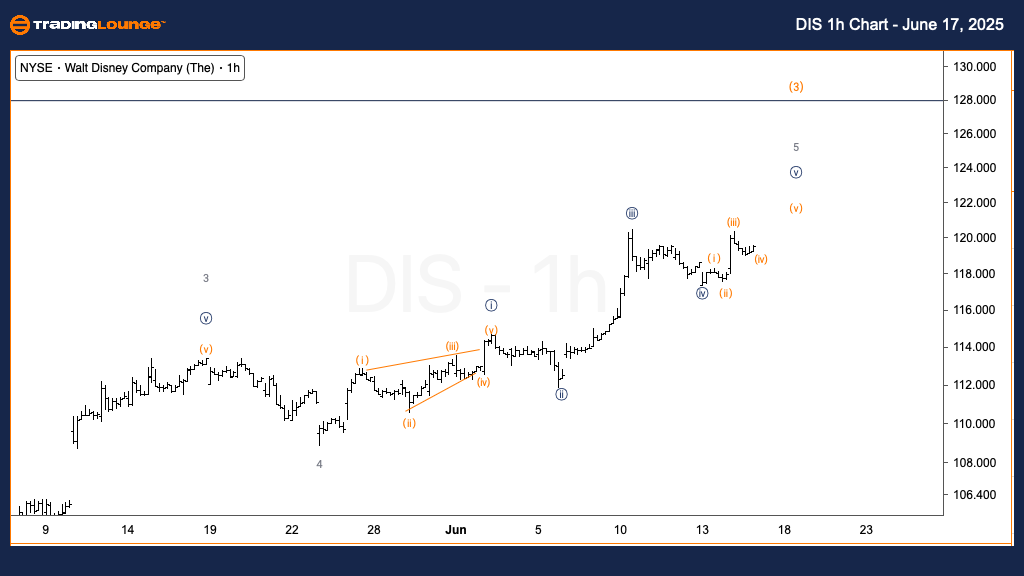
Function: Trend
Mode: Impulsive
Structure: Motive
Position: Wave {v} of 5
Direction: Uptrend in wave {v}
Details: In the short-term view, Elliott Wave projections indicate that Disney (DIS) may be approaching the completion of wave {v} of 5. A temporary high could form, followed by a minor corrective pullback. Despite this, the dominant trend remains upward.
Technical Analyst: Alessio Barretta
Source: Visit Tradinglounge.com and learn from the Experts. Join TradingLounge Here
Previous: Alphabet Inc. (GOOGL) Elliott Wave Technical Analysis
VALUE Offer - $1 for 2 Weeks then $29 a month!Click here
Access 7 Analysts Over 200 Markets Covered. Chat Room With Support
Summary of DIS Technical Analysis
This Elliott Wave forecast for The Walt Disney Co. (DIS) includes insights from both daily and intraday (1-hour) charts, highlighting the evolving wave structure and potential price trajectory.
On the daily chart, Disney is trending upward in an impulsive wave (3) of C, suggesting sustained strength. The ongoing rally is poised to extend through wave 5, likely reaching the top of Minor Group 1, supporting a bullish continuation pattern.
On the 1-hour chart, the analysis indicates wave {v} of 5 is nearing completion. This suggests a possible short-term peak and slight pullback. However, the overarching trend remains bullish, reinforcing long-term upward potential for DIS stock.