14Jul

BHP GROUP LIMITED - BHP Elliott Wave Analysis: Forecasts Bullish Wave 3 After Zigzag Correction With Price Targets

ASX: BHP GROUP LIMITED - BHP Elliott Wave Technical Analysis – TradingLounge

Greetings,
This Elliott Wave market analysis focuses on BHP GROUP LIMITED (ASX: BHP), listed on the Australian Securities Exchange.

A bullish opportunity has emerged as wave 2) orange completed its Zigzag correction. Now, wave 3) orange may be developing, indicating a possible upward price movement. This outlook outlines key resistance targets and the crucial invalidation point that maintains the current bullish bias.


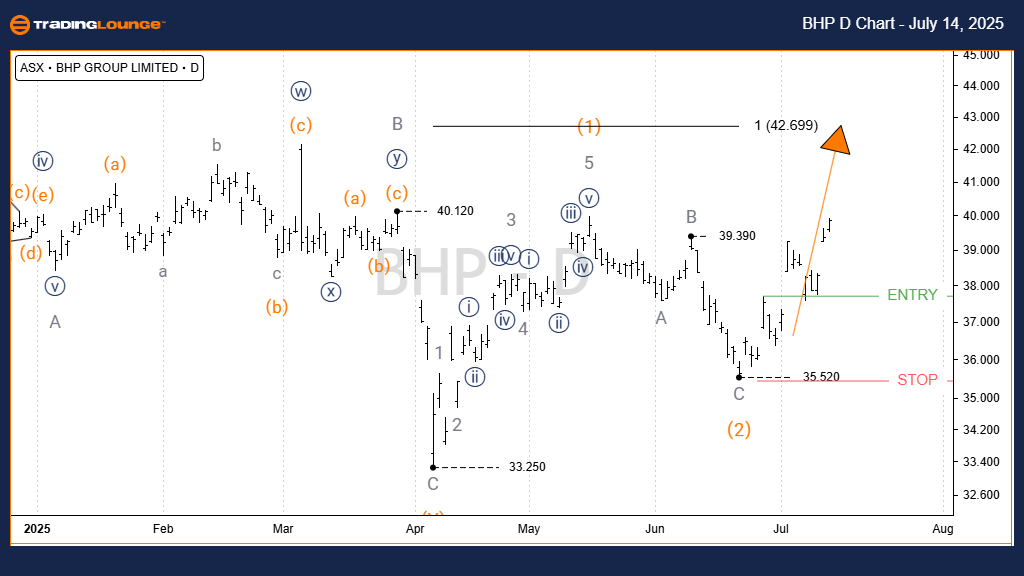
ASX: BHP GROUP LIMITED - BHP Elliott Wave Technical Analysis – 1D Chart (Semilog Scale)

Function: Intermediate trend (Orange degree)

Wave Mode: Motive

Wave Structure: Impulse

Wave Position: Wave 3) orange

Technical Breakdown:
Wave 1) orange initiated from the low at 33.25 and unfolded into a complete five-wave impulsive move. Wave 2) orange then corrected in a clear A-B-C Zigzag formation. This corrective phase appears to have ended, allowing wave 3) orange to commence. The projected upside target lies between 42.70 and 47.84, provided the price holds above the critical support at 35.52.

Invalidation Level: 35.52

BHP-d-asx-chart-1407...


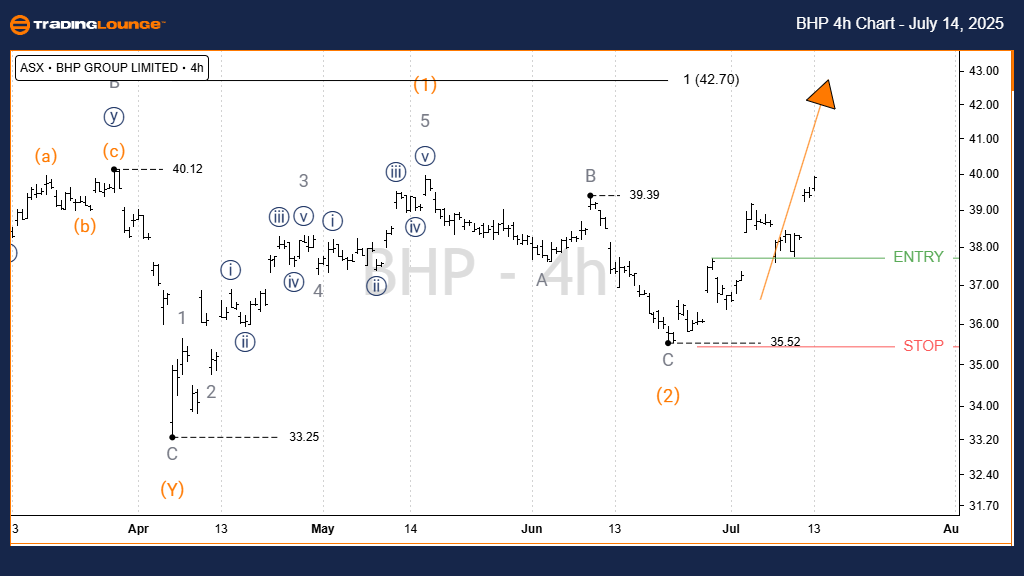
ASX: BHP GROUP LIMITED - BHP Elliott Wave Technical Analysis – TradingLounge (4-Hour Chart)

Function: Intermediate trend (Orange degree)

Wave Mode: Motive

Wave Structure: Impulse

Wave Position: Wave 3) orange

Technical Breakdown:
The 4-hour chart confirms the same bullish structure seen in the daily chart. A long trade setup may activate once the price breaks above a clearly defined resistance level. For this bullish scenario to remain valid, the price must stay above the 35.52 invalidation mark.

Technical Analyst: Hua (Shane) Cuong, CEWA‑M (Certified Elliott Wave Analyst – Master Level)

Source: Visit Tradinglounge.com and learn from the Experts. Join TradingLounge Here 

See Previous: NEWMONT CORPORATION - NEM Elliott Wave Technical Analysis

VALUE Offer - Buy 1 Month & Get 3 Months!Click here

Access 7 Analysts Over 200 Markets Covered. Chat Room With Support

BHP-4h-asx-chart-140...


Conclusion:
This updated Elliott Wave forecast for ASX: BHP GROUP LIMITED (BHP) provides actionable market insights and technical clarity. By defining bullish targets and the invalidation level, this analysis supports traders in making informed decisions. Our mission remains to deliver precise and strategic guidance based on advanced wave theory.

Related

NIFTY 50 Elliott Wave Technical Analysis: Expanded Flat Correction Nears 25,000-25,100, Key Support at 22,700

NIFTY 50 Elliott Wave Technical Analysis: Expanded Flat Correction Nears 25,000-25,100, Key Support at 22,700

The NIFTY 50 Index is currently in a corrective wave phase, moving towards 25,000-25,100 as part of ...

Read More >
Learn about the current stock trend: Texas Instruments Inc.(TXN) Stocks Elliott Wave Technical Analysis

Learn about the current stock trend: Texas Instruments Inc.(TXN) Stocks Elliott Wave Technical Analysis

Explore an in-depth Elliott Wave analysis for Texas Instruments Inc. (TXN), including daily and 4-ho...

Read More >
Ethereum / U.S. dollar(ETHUSD) Elliott Wave Technical Analysis 3 November 23

Ethereum / U.S. dollar(ETHUSD) Elliott Wave Technical Analysis 3 November 23

Ethereum/U.S. dollar(ETHUSD) Elliott Wave Technical Analysis on 3 November 23 with 4-hour and daily ...

Read More >
Amazon Stock Elliott Wave Analysis: AMZN Forecast Shows Corrective Zigzag Pattern with $159 Price Target and Potential Reversal Ahead

Amazon Stock Elliott Wave Analysis: AMZN Forecast Shows Corrective Zigzag Pattern with $159 Price Target and Potential Reversal Ahead

Elliott Wave analysis of Amazon (AMZN) stock using daily and hourly charts. It identifies a correcti...

Read More >
Bovespa Index Elliott Wave Count Signals Bullish Market Trend With Strong Impulse Waves and Key Technical Support Levels

Bovespa Index Elliott Wave Count Signals Bullish Market Trend With Strong Impulse Waves and Key Technical Support Levels

Discover a bullish Elliott Wave analysis of the Bovespa Index with clear daily and weekly wave count...

Read More >

$1 for 2 Weeks

then $29 a month!

What a Special Offer!

Trade Recommendations

Unleash the power of deversified trading with our comprehensive portfolio, covering 250+ markets:

  • Stock Trades
  • Crypto Trades
  • Forex Trades
  • Commodity Trades
Elliott Wave Analysis

Gain a competitive edge with expert insights and AI-powered Elliott Wave charting into:

  • Global Indices
  • US Stocks & ASX Stocks
  • Forex & Crypto
  • Commodities
Top-Notch Trading Tools

Equip yourself with the tools of success:

  • Real-time Chat rooms
  • Elliott Wave Algorithm
  • Portfolio tools
  • TradingLevels
  • Screener
  • Trading Game
7 Elliott Wave Analysts

Stay ahead of the market with daily charts and insightful videos
Your secret to strategic trading!

JOIN HERE


Welcome to TradingLounge (ASIC A.R.No. 321187), specialists in trades, trading education and technical analysis, covering stocks, indices, commodities, forex and cryptocurrencies.

When you join TradingLounge you have access to everything we offer, including trade tools, educational content and a social platform to chat with like-minded investors.

Read more

@Copyright 2024 by tradinglounge.com

Contact Us

Australian no: 02 4787 6020

International no: +61 (2) 47876020

Pay with:

Find us on