TradingLounge Commodity Silver (XAGUSD) Elliott Wave Analysis

Silver Elliott Wave Technical Analysis

The recent activity in the silver market offers a notable opportunity for traders. Silver is finalizing its recovery from a pullback that started in late May 2024. This recovery phase is likely to trigger a series of rallies, continuing the ongoing bullish impulse cycle that has lasted for over a year. Both long-term and medium-term Elliott Wave projections suggest further upward movement for silver.

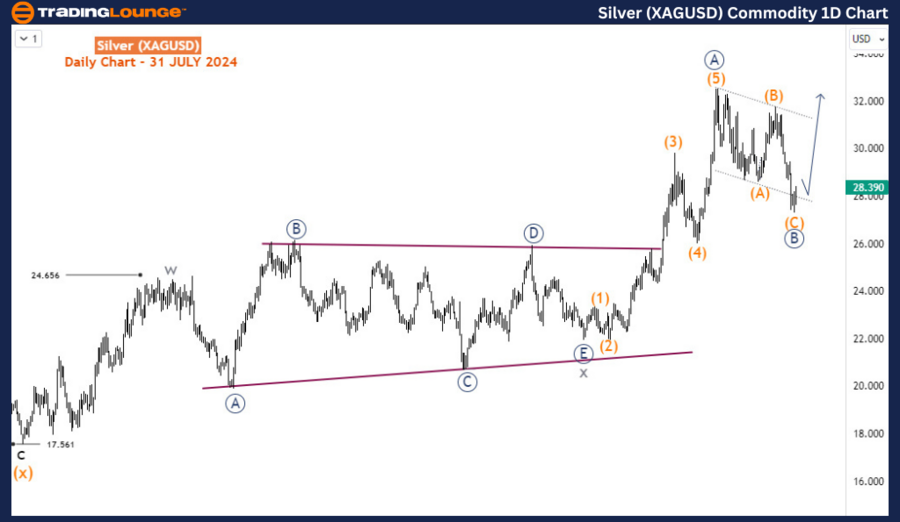
Silver (XAGUSD) Daily Chart Analysis

On the daily chart, the impulse wave sequence initiated in January 2024 concluded in May 2024, followed by a corrective pullback. This impulse sequence is identified as wave A (circled), with the subsequent pullback labeled as wave B (circled). After wave B (circled), wave C (circled) is anticipated to develop into another impulse wave structure, similar to wave A (circled), potentially reaching $38 in the coming weeks. Alternatively, the expected bullish reaction might complete another corrective bounce, potentially extending wave B (circled) lower in a double zigzag pattern.

Silver-XAGUSD-Commod...


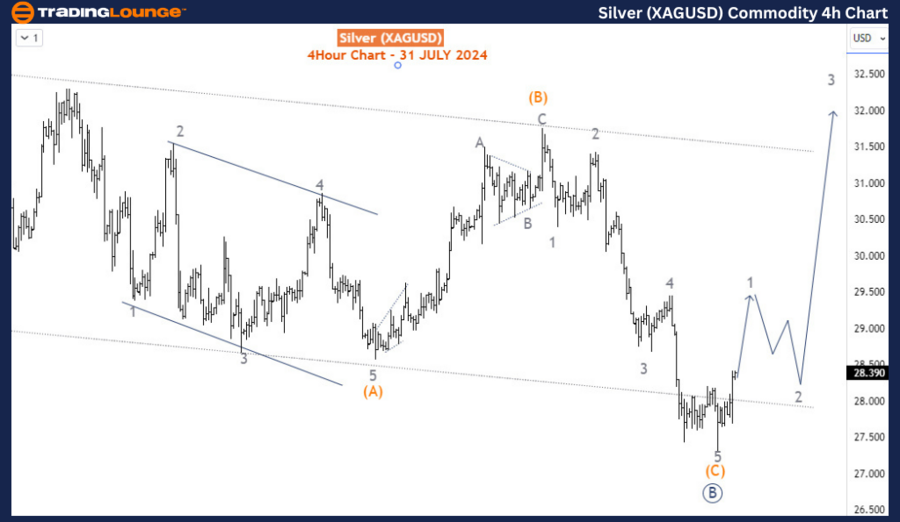
Silver (XAGUSD) 4-Hour Chart Analysis

The H4 chart provides a detailed view of the sub-waves within wave B (circled), showcasing the completion of a zigzag price pattern. The initial rally is predicted to form an impulse wave, completing wave 1 of (1) of C (circled). This bullish movement should aim for at least the $30 key level, followed by a pullback, and then a stronger rally for wave 3 of (1). However, if a corrective response occurs, it could result in a deeper bearish pushback for silver.

Summary

In summary, the Elliott Wave analysis for silver indicates that the current recovery phase is setting the stage for significant rallies. Key levels to monitor include the $30 level and the potential peak at $38. Traders should be prepared for the completion of wave B (circled) and the subsequent bullish wave C (circled). By closely observing wave patterns and critical price levels, traders can anticipate future movements in the silver market and make well-informed decisions to capitalize on the expected uptrend.

Technical Analyst: Sanmi Adeagbo

Source: visit Tradinglounge.com and learn From the Experts Join TradingLounge Here 

See Previous: Wheat Elliott Wave Technical Analysis

Special Trial Offer - 0.76 Cents a Day for 3 Months! Click here

Access 7 Analysts Over 170 Markets Covered. Chat Room With Support

Silver-XAGUSD-Commod...

Related

Silver (XAGUSD) Commodity Elliott Wave Technical Analysis Provides Essential insights for navigating the Silver market

Silver (XAGUSD) Commodity Elliott Wave Technical Analysis Provides Essential insights for navigating the Silver market

Discover the most up-to-date Silver Elliott Wave Analysis, including accurate price forecasts and ma...

Read More >
NVIDIA Corp.(NVDA) Stock Elliott Wave Technical Analysis : Market analysis shows NVDA Stock performance.

NVIDIA Corp.(NVDA) Stock Elliott Wave Technical Analysis : Market analysis shows NVDA Stock performance.

This detailed analysis leverages the Elliott Wave Theory to provide a deep dive into NVIDIA Corporat...

Read More >
Expert Technical Analysis for Optimal Trading: WiseTech Global Limited (ASX: WTC) Elliott Wave Analysis

Expert Technical Analysis for Optimal Trading: WiseTech Global Limited (ASX: WTC) Elliott Wave Analysis

Explore our detailed Elliott Wave analysis of WiseTech Global Limited (ASX: WTC). Understand current...

Read More >
NIFTY 50 (India) Elliott Wave Analysis: Technical Insights, Forecasted Price Movements, and Key Trading Opportunities

NIFTY 50 (India) Elliott Wave Analysis: Technical Insights, Forecasted Price Movements, and Key Trading Opportunities

Elliott Wave analysis for NIFTY 50, highlighting key resistance and support levels, potential correc...

Read More >
The Walt Disney Co. (DIS) Elliott Wave Analysis Reveals Bullish Daily Wave (3) Momentum and Short-Term Wave {v} Top

The Walt Disney Co. (DIS) Elliott Wave Analysis Reveals Bullish Daily Wave (3) Momentum and Short-Term Wave {v} Top

DIS Elliott Wave analysis examines Disney’s daily and 1‑hour charts. On the daily timeframe, DIS i...

Read More >

$1 for 2 Weeks

then $29 a month!

What a Special Offer!

Trade Recommendations

Unleash the power of deversified trading with our comprehensive portfolio, covering 250+ markets:

  • Stock Trades
  • Crypto Trades
  • Forex Trades
  • Commodity Trades
Elliott Wave Analysis

Gain a competitive edge with expert insights and AI-powered Elliott Wave charting into:

  • Global Indices
  • US Stocks & ASX Stocks
  • Forex & Crypto
  • Commodities
Top-Notch Trading Tools

Equip yourself with the tools of success:

  • Real-time Chat rooms
  • Elliott Wave Algorithm
  • Portfolio tools
  • TradingLevels
  • Screener
  • Trading Game
7 Elliott Wave Analysts

Stay ahead of the market with daily charts and insightful videos
Your secret to strategic trading!

JOIN HERE


Welcome to TradingLounge (ASIC A.R.No. 321187), specialists in trades, trading education and technical analysis, covering stocks, indices, commodities, forex and cryptocurrencies.

When you join TradingLounge you have access to everything we offer, including trade tools, educational content and a social platform to chat with like-minded investors.

Read more

@Copyright 2024 by tradinglounge.com

Contact Us

Australian no: 02 4787 6020

International no: +61 (2) 47876020

Pay with:

Find us on