Wheat Commodity Elliott Wave Analysis

Since peaking in March 2022, Wheat prices have experienced a significant decline of nearly 62%, falling from over 1360 to around 530. However, this bearish trend appears to be approaching its conclusion, with a potential multi-month bullish phase on the horizon, poised to correct the over 28 months of downward movement.

Wheat Commodity Elliott Wave Technical Analysis

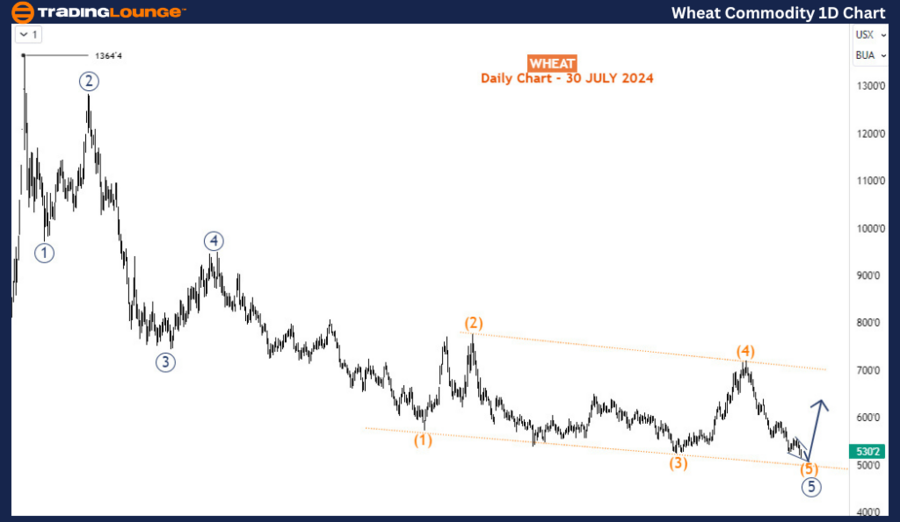
Wheat Daily Chart Analysis

On the daily chart, the decline from the March 2022 peak of 1364 is characterized by an impulse wave structure. Currently, this structure is in its final stage, with the 5th wave nearing completion in an ending diagonal pattern. Although Wheat prices might still dip to around 500 or slightly below, caution is advised for sellers at this point. The upcoming weeks and months are likely to see an exit from short positions, paving the way for new bullish positions.

Wheat-Commodity-1D-C...


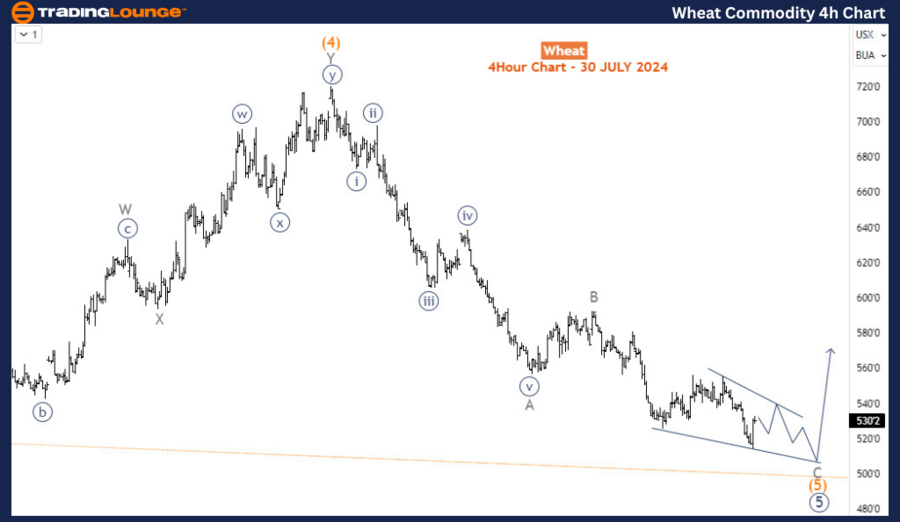
Wheat H4 Chart Analysis

The H4 chart indicates that wave c of (5) of 5 (circled) is nearing completion, likely forming an ending diagonal structure. The 500 level is anticipated to provide strong support, potentially leading to at least a 3-swing bounce, which could push prices above 800.

Summary

In summary, the Elliott Wave analysis for Wheat suggests that the current bearish cycle is nearing its end, and a significant bullish correction is expected to follow. Key levels to watch include the support at 500 and the potential rebound above 800. Traders should be ready for the end of the current decline and consider opportunities to enter long positions as the market transitions into a new bullish phase. By closely monitoring wave structures and critical price levels, traders can better anticipate future movements in the Wheat market and make informed decisions to capitalize on the impending uptrend.

Technical Analyst: Sanmi Adeagbo

Source: visit Tradinglounge.com and learn From the Experts Join TradingLounge Here 

See Previous: Coffee Elliott Wave Technical Analysis

Special Trial Offer - 0.76 Cents a Day for 3 Months! Click here

Access 7 Analysts Over 170 Markets Covered. Chat Room With Support

Wheat-Commodity-4hr-...

Related

Eli Lilly & Co. (LLY) Elliott Wave Technical Analysis: Focusing on Stock Forecasts, Technical Chart Patterns, and Trading Strategies

Eli Lilly & Co. (LLY) Elliott Wave Technical Analysis: Focusing on Stock Forecasts, Technical Chart Patterns, and Trading Strategies

This article offers a detailed Elliott Wave analysis of Eli Lilly & Co. (LLY), focusing on stock for...

Read More >
Alphabet Inc.(GOOGL:NASDAQ) Elliott Wave Technical Analysis 4 December 23

Alphabet Inc.(GOOGL:NASDAQ) Elliott Wave Technical Analysis 4 December 23

Alphabet Inc.(GOOGL: NASDAQ) Elliott Wave Technical Analysis dated 4 December 23 includes Stock Mark...

Read More >
Elliott Wave Techniacl Analysis for Berkshire Hathaway Inc. (BRK:B): Daily and 1-Hour Chart Insights to Predict Stock Price Movements

Elliott Wave Techniacl Analysis for Berkshire Hathaway Inc. (BRK:B): Daily and 1-Hour Chart Insights to Predict Stock Price Movements

Elliott Wave analysis examines the daily and 1-hour charts of Berkshire Hathaway (BRK.B) and Visa In...

Read More >
Unveiling Advanced Trading Strategies and Stock Predictions: Analog Devices Inc.(ADI) Stocks Elliott Wave Technical Analysis

Unveiling Advanced Trading Strategies and Stock Predictions: Analog Devices Inc.(ADI) Stocks Elliott Wave Technical Analysis

This article provides a thorough Elliott Wave analysis for Analog Devices Inc. (ADI), offering insig...

Read More >
Coffee Price Forecast: Coffee Commodity Elliott Wave Technical Analysis, Key Market Trends, and Upcoming Bullish Rally Insights

Coffee Price Forecast: Coffee Commodity Elliott Wave Technical Analysis, Key Market Trends, and Upcoming Bullish Rally Insights

This comprehensive analysis of coffee prices focuses on Elliott Wave patterns and market trends. It ...

Read More >
S&P 500, NASDAQ 100, DAX 40, FTSE 100, ASX 200: Elliott Wave Analysis & Trading Strategies | TradingLounge

S&P 500, NASDAQ 100, DAX 40, FTSE 100, ASX 200: Elliott Wave Analysis & Trading Strategies | TradingLounge

Access actionable Elliott Wave trading strategies for the S&P 500, NASDAQ 100, DAX 40, FTSE 100, and...

Read More >

$1 for 2 Weeks

then $29 a month!

What a Special Offer!

Trade Recommendations

Unleash the power of deversified trading with our comprehensive portfolio, covering 250+ markets:

  • Stock Trades
  • Crypto Trades
  • Forex Trades
  • Commodity Trades
Elliott Wave Analysis

Gain a competitive edge with expert insights and AI-powered Elliott Wave charting into:

  • Global Indices
  • US Stocks & ASX Stocks
  • Forex & Crypto
  • Commodities
Top-Notch Trading Tools

Equip yourself with the tools of success:

  • Real-time Chat rooms
  • Elliott Wave Algorithm
  • Portfolio tools
  • TradingLevels
  • Screener
  • Trading Game
7 Elliott Wave Analysts

Stay ahead of the market with daily charts and insightful videos
Your secret to strategic trading!

JOIN HERE


Welcome to TradingLounge (ASIC A.R.No. 321187), specialists in trades, trading education and technical analysis, covering stocks, indices, commodities, forex and cryptocurrencies.

When you join TradingLounge you have access to everything we offer, including trade tools, educational content and a social platform to chat with like-minded investors.

Read more

@Copyright 2024 by tradinglounge.com

Contact Us

Australian no: 02 4787 6020

International no: +61 (2) 47876020

Pay with:

Find us on