JP Morgan Chase & Co., Elliott Wave Technical Analysis
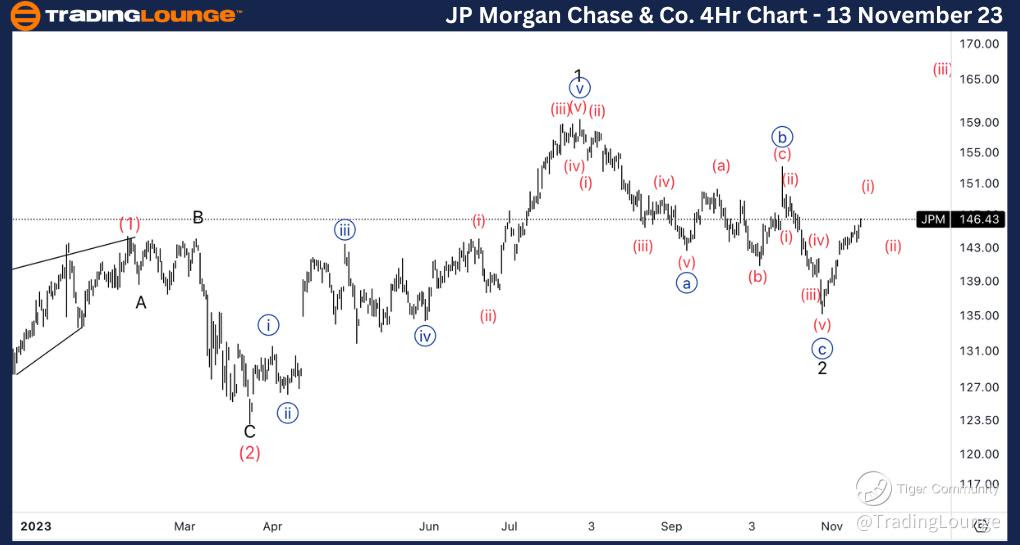
JP Morgan Chase & Co., (JPM:NYSE): 4h Chart 13 November 23
JPM Stock Market Analysis: We have been looking for upside into wave 3 as we have identifie what seems to be a three wave move in wave 2. Looking for additional confirmation, with 150$ to turn into support, before considering longs.
JPM Elliott Wave Count: Wave {i} of 3.
JPM Technical Indicators: Above all averages.
JPM Trading Strategy: Looking for longs on the support off 150$.
TradingLounge Analyst: Alessio Barretta
Source: Tradinglounge.com get trial here!
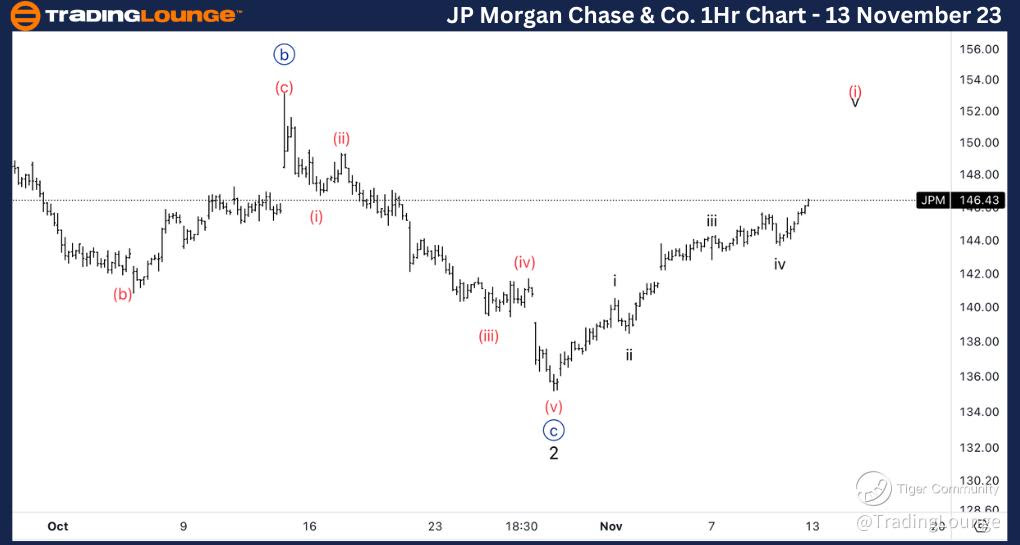
JP Morgan Chase & Co., JPM: 1-hour Chart 13 November 23
JP Morgan Chase & Co., Elliott Wave Technical Analysis
JPM Stock Market Analysis: Looking for a potential last move up into wave v of (i), to then pullback into wave (ii). We could see resistance on 150$.
JPM Elliott Wave count: Wave v of (i).
JPM Technical Indicators: Above all averages.
JPM Trading Strategy: Looking longs into wave v.