Analog Devices Inc. (ADI) is exhibiting a strong bullish trend according to the latest Elliott Wave analysis. Here’s a detailed breakdown of the current market scenario based on the daily and 4-hour charts.

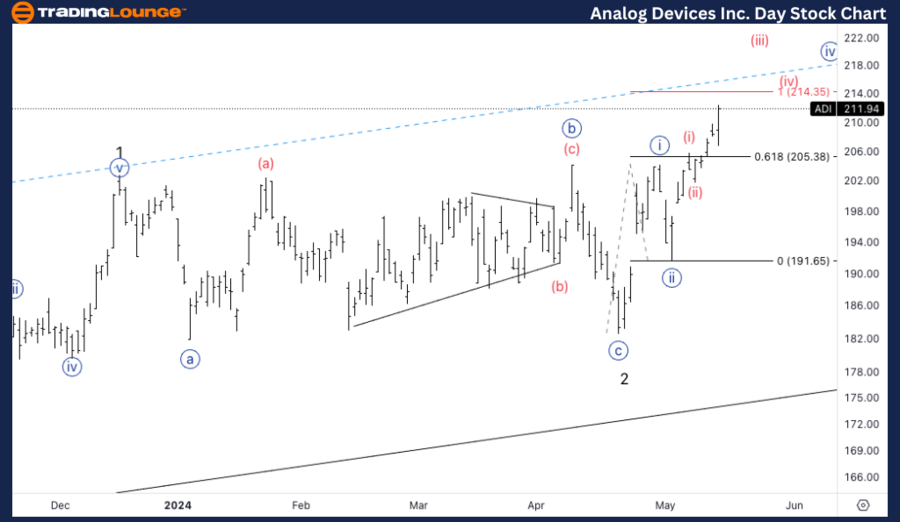
ADI Elliott Wave Analysis Trading Lounge: Daily Chart Insights

Analog Devices Inc., (ADI) Daily Chart Overview

Elliott Wave Technical Analysis for ADI

Function: Trend Identification

Mode: Impulsive Movement

Structure: Motive Sequence

Current Position: Minute wave {iii}

Projected Direction: Upward Movement in Minute {iii}

Key Resistance Level: Anticipating a major resistance at the $250 mark, which aligns with MG1 trading strategies.

ADI Elliott Wave Technical Analysis – Daily Chart

The daily chart for ADI reveals that the stock is in Minute wave {iii}, part of an impulsive move. The next significant level to watch is the Medium Level at $250, which is expected to provide strong resistance. As ADI trades within MG1, this level becomes a critical point for potential price action. Traders should be aware of this resistance zone and monitor the price behavior closely as it approaches $250.

Analog-Devices-Inc-1...


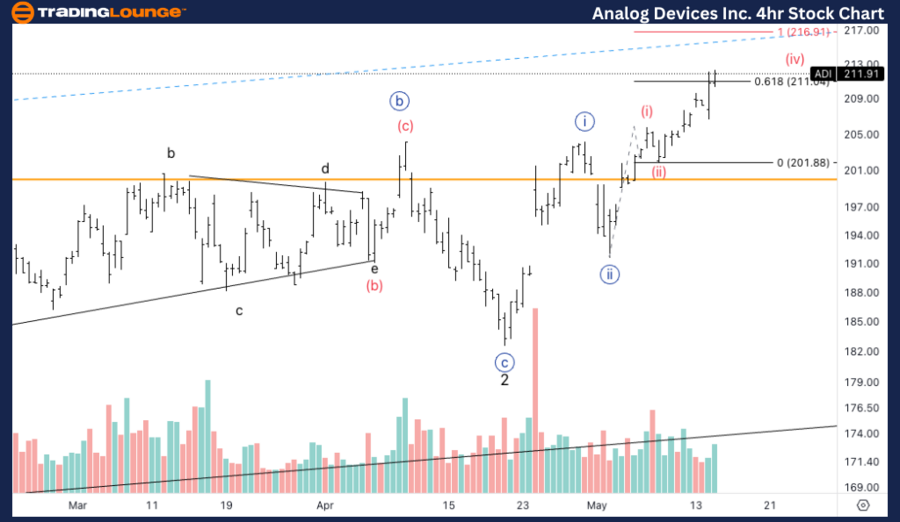
ADI Elliott Wave Analysis Trading Lounge: 4-Hour Chart Review

Analog Devices Inc., (ADI) 4-Hour Chart Examination

Elliott Wave Technical Analysis for ADI

Function: Trend Analysis

Mode: Impulsive Behavior

Structure: Motive Phase

Current Position: Wave (iii) of {iii}

Trend Direction: Continuing Wave (iii)

Volume Analysis: Strong volume indicators support a bullish trend, with expectations of sustained upward momentum.

ADI Elliott Wave Technical Analysis – 4Hr Chart

The 4-hour chart complements the daily analysis by highlighting that ADI is in wave (iii) of Minute wave {iii}. The volume analysis suggests that the bullish trend is well-supported, indicating a likely continuation higher. This wave structure confirms the impulsive nature of the current market move, reinforcing the bullish outlook.

Technical Analyst: Malik Awais

Source: visit Tradinglounge.com and learn From the Experts Join TradingLounge Here 

See Previous: Eaton Corp. PLC, (ETN) Stock Analysis

Special Trial Offer - 0.76 Cents a Day for 3 Months! Click here

Access 7 Analysts Over 170 Markets Covered. Chat Room With Support

Analog-Devices-Inc-4...

Related

Stay ahead in the cryptocurrency market: Dogecoin Crypto Price News Today Elliott Wave Technical Analysis

Stay ahead in the cryptocurrency market: Dogecoin Crypto Price News Today Elliott Wave Technical Analysis

Explore our in-depth Dogecoin Elliott Wave Analysis, providing accurate price predictions and techni...

Read More >
TASI Index Elliott Wave Forecast Highlights Bullish Wave 3 Structure with Key Trading Levels for Saudi Stock Market Investors

TASI Index Elliott Wave Forecast Highlights Bullish Wave 3 Structure with Key Trading Levels for Saudi Stock Market Investors

TASI Index's impulsive bullish structure using Elliott Wave Theory, outlining key wave positions...

Read More >
Elliott Wave Analysis of ASX: MINERAL RESOURCES LIMITED (MIN) – Stock Forecast, Entry Points, and Market Trends for Traders

Elliott Wave Analysis of ASX: MINERAL RESOURCES LIMITED (MIN) – Stock Forecast, Entry Points, and Market Trends for Traders

Elliott Wave analysis of MINERAL RESOURCES LIMITED (ASX: MIN), offering insights into key price leve...

Read More >
MINERAL RESOURCES LIMITED - MIN Elliott Wave Analysis Reveals Upside Targets After Wave 4 Ends Around $14.05 Low

MINERAL RESOURCES LIMITED - MIN Elliott Wave Analysis Reveals Upside Targets After Wave 4 Ends Around $14.05 Low

Elliott Wave technical analysis for Mineral Resources Limited (ASX: MIN) shows Wave 4 is likely comp...

Read More >
Texas Instruments (TXN) Stock Ready for a Breakout? TXN Elliott Wave Technical Analysis Reveals Key Levels and Price Trends!

Texas Instruments (TXN) Stock Ready for a Breakout? TXN Elliott Wave Technical Analysis Reveals Key Levels and Price Trends!

This Texas Instruments (TXN) Elliott Wave analysis examines TXN stock price trends, identifying key ...

Read More >
Ideal for investors seeking accurate CAT stock analysis: Caterpillar Inc. (CAT) Elliott Wave Technical Analysis

Ideal for investors seeking accurate CAT stock analysis: Caterpillar Inc. (CAT) Elliott Wave Technical Analysis

This article provides an in-depth Elliott Wave analysis of Caterpillar Inc. (CAT), offering detailed...

Read More >

$1 for 2 Weeks

then $29 a month!

What a Special Offer!

Trade Recommendations

Unleash the power of deversified trading with our comprehensive portfolio, covering 250+ markets:

  • Stock Trades
  • Crypto Trades
  • Forex Trades
  • Commodity Trades
Elliott Wave Analysis

Gain a competitive edge with expert insights and AI-powered Elliott Wave charting into:

  • Global Indices
  • US Stocks & ASX Stocks
  • Forex & Crypto
  • Commodities
Top-Notch Trading Tools

Equip yourself with the tools of success:

  • Real-time Chat rooms
  • Elliott Wave Algorithm
  • Portfolio tools
  • TradingLevels
  • Screener
  • Trading Game
7 Elliott Wave Analysts

Stay ahead of the market with daily charts and insightful videos
Your secret to strategic trading!

JOIN HERE


Welcome to TradingLounge (ASIC A.R.No. 321187), specialists in trades, trading education and technical analysis, covering stocks, indices, commodities, forex and cryptocurrencies.

When you join TradingLounge you have access to everything we offer, including trade tools, educational content and a social platform to chat with like-minded investors.

Read more

@Copyright 2024 by tradinglounge.com

Contact Us

Australian no: 02 4787 6020

International no: +61 (2) 47876020

Pay with:

Find us on