26Apr

Microsoft Inc.(MSFT) Stocks Elliott Wave Technical Analysis: Navigating Through Corrective Patterns

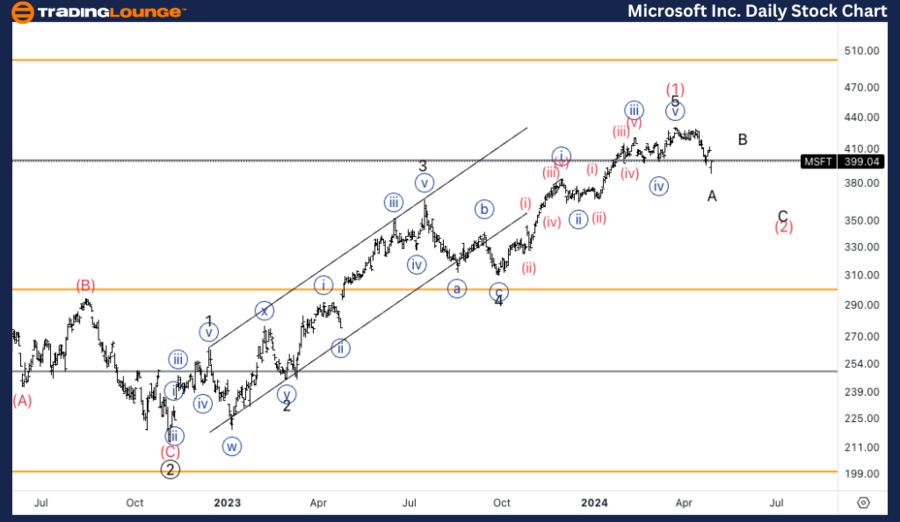
MSFT Elliott Wave Analysis Trading Lounge Daily Chart

Microsoft Inc., (MSFT) Daily Chart
MSFT Elliott Wave Technical Analysis

FUNCTION: Counter Trend
MODE: Corrective
STRUCTURE: Zigzag
POSITION: Intermediate (2)
DIRECTION: Bottom in wave A of (2).  
DETAILS: We are considering a significant top in place with wave (1), and we are now looking for a three wave move correction into wave (2). We seem to be finding buyers on Medium Levell 400$, looking for 400$ to turn into resistance.  

MSFT Elliott Wave Technical Analysis – Daily Chart

The daily chart of MSFT shows the stock in a corrective phase with a zigzag structure, identified as Intermediate wave (2). Currently, the stock is witnessing a bottom formation in wave A of (2). After observing a significant top in wave (1), MSFT appears to be undergoing a corrective three-wave movement. The price level around $400, which has been attracting buyers, is anticipated to evolve into a resistance level. Traders should monitor this zone closely for potential reversal signals.

Microsoft-Inc-DAILY-...


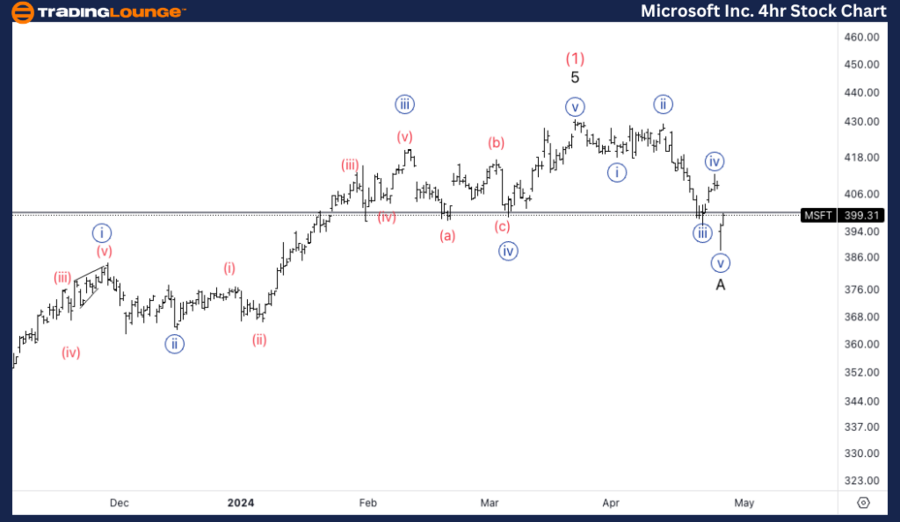
MSFT Elliott Wave Analysis Trading Lounge 4Hr Chart

Microsoft Inc., (MSFT) 4Hr Chart
MSFT Elliott Wave Technical Analysis

FUNCTION: Counter Trend
MODE: Corrective
STRUCTURE: Zigzag
POSITION: Wave A.  
DIRECTION: Bottom in wave {v}.
DETAILS: I can count a clear five wave move into wave A, with alternation between {ii} and {iv}. Looking for a pullback in wave B to then fall back lower.

In this comprehensive Elliott Wave analysis for Microsoft Corporation (MSFT), we provide an in-depth review of the stock’s potential movements based on its current wave patterns, as observed in both the daily and 4-hour charts on April 26, 2024. This analysis aims to assist traders and investors in understanding the underlying market dynamics and planning their strategies accordingly.

MSFT Elliott Wave Technical Analysis – 4Hr Chart

Moving into the 4-hour chart, the analysis continues to reflect a counter-trend with a zigzag corrective structure, highlighting the end of Wave A. Here, a clear five-wave movement has been identified, with distinct alternations between waves {ii} and {iv}. The current position, at the bottom of wave {v}, suggests that the stock might experience a short-term pullback in wave B before potentially declining further. This provides a strategic point for traders to look for entry and exit points during the unfolding of wave B.

Technical Analyst: Alessio Barretta

Source: visit Tradinglounge.com and learn From the Experts Join TradingLounge Here 

See Previous: Texas Instruments Inc., (TXN) 

Special Trial Offer - 0.76 Cents a Day for 3 Months!  Click here
Access 6 Analysts covering over 150 Markets. Chat Room With Support

Microsoft-Inc-4H-STO...

Related

Amazon Inc.(AMZN:NASDAQ) Elliott Wave Technical Analysis 25 October 23

Amazon Inc.(AMZN:NASDAQ) Elliott Wave Technical Analysis 25 October 23

Amazon Inc.(AMZN:NASDAQ) Elliott Wave Technical Analysis For 25 October 23 with 1-Hour and 4-Hour St...

Read More >
Elliott Wave analysis of Commonwealth Bank of Australia (CBA) Stock Provides Insights into the Current Market trends on the ASX

Elliott Wave analysis of Commonwealth Bank of Australia (CBA) Stock Provides Insights into the Current Market trends on the ASX

This comprehensive Elliott Wave analysis of Commonwealth Bank of Australia (CBA) stock provides insi...

Read More >
Technical Insights on Gold Commodity Trading and Potential Corrections: Gold (XAUUSD) Elliott Wave Technical Analysis

Technical Insights on Gold Commodity Trading and Potential Corrections: Gold (XAUUSD) Elliott Wave Technical Analysis

This analysis provides a comprehensive Elliott Wave forecast for Gold, highlighting key market trend...

Read More >
Elliott Wave Analysis Highlights: Navigating Commodity Market Trends with Confidence

Elliott Wave Analysis Highlights: Navigating Commodity Market Trends with Confidence

This summary highlights the key points from an Elliott Wave analysis update on commodity markets. Th...

Read More >
SBI LIFE INSURANCE CO. Stock Elliott Wave Technical Analysis: In-Depth Stock Forecast and Market Trends

SBI LIFE INSURANCE CO. Stock Elliott Wave Technical Analysis: In-Depth Stock Forecast and Market Trends

This analysis provides an in-depth look at SBI Life Insurance (SBILIFE) stock using Elliott Wave the...

Read More >
Enhance your Forex Trading Strategies With New Zealand Dollar/U.S. Dollar (NZDUSD) Forex Elliott Wave Technical Analysis

Enhance your Forex Trading Strategies With New Zealand Dollar/U.S. Dollar (NZDUSD) Forex Elliott Wave Technical Analysis

Our detailed Elliott Wave analysis gives a comprehensive understanding of the NZDUSD currency pair. ...

Read More >

Buy 1 Month

Get 3 Months!

Special Offer:

Trade Recommendations

Unleash the power of deversified trading with our comprehensive portfolio, covering:

  • Stock Trades
  • Crypto Trades
  • Forex Trades
  • Commodity Trades
Elliott Wave Analysis

Gain a competive edge with expert insights in to:

  • Global Indices
  • US Stocks & ASX Stocks
  • Forex & Crypto
  • Commodities
Top-Notch Trading Tools

Equip yourself with the tools of success:

  • Social Chat
  • Elliott Wave Algorithm
  • Screener
  • TradingLevels
  • Trading Game
7 Elliott Wave Analysts

Stay ahead of the market with daily charts and insightful videos
-Your secret to strategic trading!

JOIN HERE


Welcome to TradingLounge (ASIC A.R.No. 321187), specialists in trades, trading education and technical analysis, covering stocks, indices, commodities, forex and cryptocurrencies.

When you join TradingLounge you have access to everything we offer, including trade tools, educational content and a social platform to chat with like-minded investors.

Read more

@Copyright 2024 by tradinglounge.com

Contact Us

Australian no: 02 4787 6020

International no: +61 (2) 47876020

Pay with:

Find us on