31Mar

BNBUSD Elliott Wave Analysis Reveals Triangle Pattern, Fibonacci Support, and Bullish Breakout Strategy for Binance Coin Traders

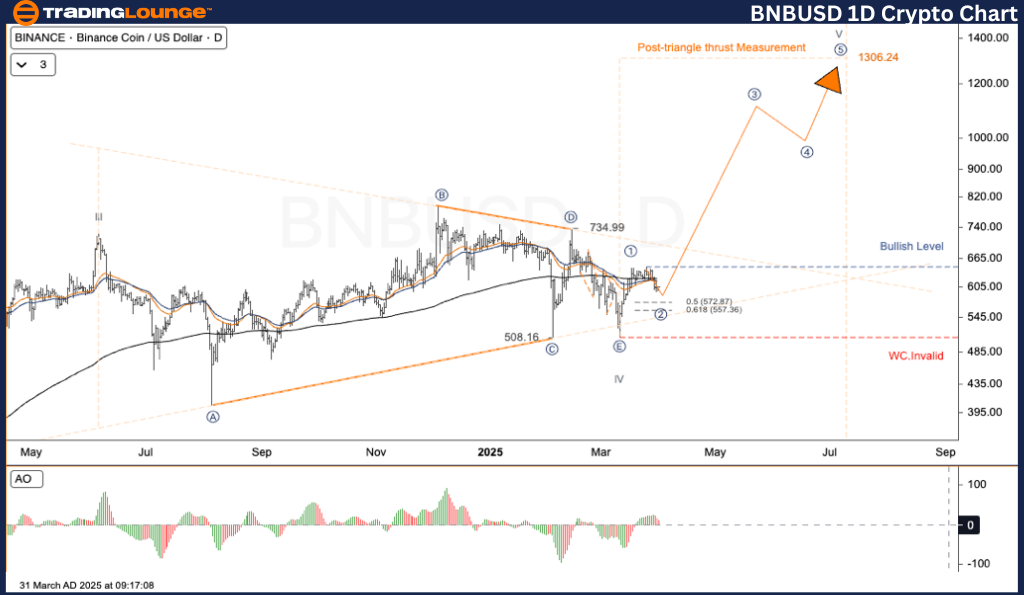
Binance/ U.S. Dollar (BNBUSD) Elliott Wave Analysis – TradingLounge Daily Chart

BNBUSD Elliott Wave Technical Review

Market Function: Counter Trend

Wave Type: Corrective

Pattern: Triangle

Current Wave: Wave E

Higher Degree Direction: Wave IV in an Impulse

Invalidation Level:

Binance/ U.S. Dollar (BNBUSD) Trading Strategy:

According to Elliott Wave Theory, BNBUSD is currently positioned in Wave IV, preparing for the potential emergence of Wave V, which is projected to be a significant bullish trend. The Post-Triangle Thrust target for this breakout scenario is calculated at $1,306.24, derived from the measured triangle height. A bullish confirmation is expected upon a breakout above the $734.99 resistance level, marking a potential trend continuation.

Trading Strategies

Approach

Method
✅ For Swing Traders (Short-Term)
A decisive price move above the $734.99 resistance level, confirmed by increased trading volume, may indicate the start of Wave V.

Risk Control
Invalidation Level: $490.00 (Price drop below this threshold invalidates the current wave count)

BNBUSD-1d-crypto-cha...


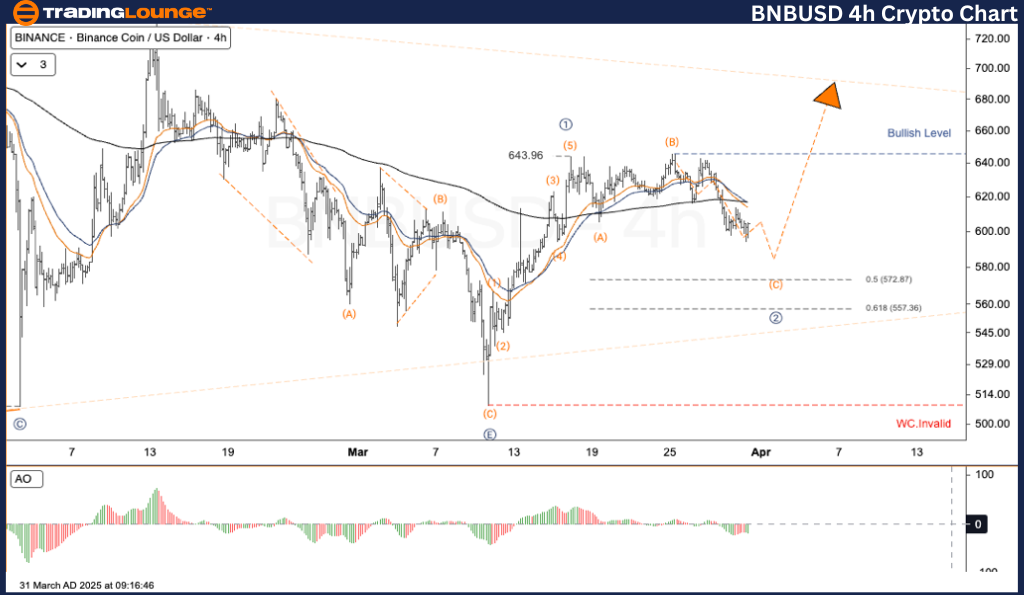
Binance/ U.S. Dollar (BNBUSD) Elliott Wave Analysis – TradingLounge H4 Chart

BNBUSD Elliott Wave Technical Review

Market Function: Counter Trend

Wave Type: Corrective

Pattern: Triangle

Current Wave: Wave E

Higher Degree Direction: Wave IV in an Impulse

Invalidation Level:

Binance/ U.S. Dollar (BNBUSD) Trading Strategy:

BNBUSD is holding within Wave IV, with sub-wave 1 already completed. The asset is now in Wave 2, a correction phase aligning with key Fibonacci retracement levels between 0.5 and 0.618 — specifically in the range of $572.87 to $557.36. A bullish reaction from this zone could trigger Wave 3, with resistance expected near $705.

Trading Strategies

Approach

Method
✅ For Swing Traders (Short-Term)
A breakout beyond $734.99, supported by high volume, could act as a catalyst for the initiation of Wave V.

Risk Control
Invalidation Level: $490.00 (Break below this point invalidates current Elliott Wave structure)

Technical Analyst: Kittiampon Somboonsod

Source: Visit Tradinglounge.com and learn from the Experts. Join TradingLounge Here 

Previous: THETAUSD Elliott Wave Technical Analysis

VALUE Offer - Buy 1 Month & Get 3 Months!Click here

Access 7 Analysts Over 200 Markets Covered. Chat Room With Support

BNBUSD-4h-crypto-cha...

Related

V300AEQ ETF UNITS – VAS Stock Analysis & Elliott Wave Technical Forecast: Detailed insights into market trends

V300AEQ ETF UNITS – VAS Stock Analysis & Elliott Wave Technical Forecast: Detailed insights into market trends

Our comprehensive Elliott Wave analysis for ASX: V300AEQ ETF Units – VAS provides detailed insights...

Read More >
Strategies for Forex Traders aiming to Capitalize on the EURUSD Market Trends: Euro/ U.S. Dollar Elliott Wave Technical Analysis

Strategies for Forex Traders aiming to Capitalize on the EURUSD Market Trends: Euro/ U.S. Dollar Elliott Wave Technical Analysis

This comprehensive analysis provides an in-depth look at the EURUSD using Elliott Wave Theory. Disco...

Read More >
Bitcoin Crypto Price News Today Elliott Wave Technical Analysis: Offering valuable insights into current market trends for BTCUSD

Bitcoin Crypto Price News Today Elliott Wave Technical Analysis: Offering valuable insights into current market trends for BTCUSD

This article provides an in-depth Elliott Wave analysis of Bitcoin against the U.S. dollar (BTCUSD),...

Read More >
AAVE/ U.S. dollar(AAVEUSD) Elliott Wave Technical Analysis: Explore the corrective phase within the Zigzag pattern

AAVE/ U.S. dollar(AAVEUSD) Elliott Wave Technical Analysis: Explore the corrective phase within the Zigzag pattern

In this Elliott Wave analysis and trading strategy overview for AAVE/USD (AAVEUSD) on February 26, w...

Read More >
VanEck Rare Earth & Strategic Metals ETF (REMX) Elliott Wave Analysis: Zigzag Pattern, and ETF Trading Strategy Insights

VanEck Rare Earth & Strategic Metals ETF (REMX) Elliott Wave Analysis: Zigzag Pattern, and ETF Trading Strategy Insights

VanEck Rare Earth & Strategic Metals ETF (REMX), focusing on the wave 4 correction within a zigzag s...

Read More >
Elliott Wave analysis for Meta Platforms Inc. (META) Stock, Covering both Daily and 4-hour charts Technical Analysis

Elliott Wave analysis for Meta Platforms Inc. (META) Stock, Covering both Daily and 4-hour charts Technical Analysis

This article provides a detailed Elliott Wave analysis for Meta Platforms Inc. (META), covering both...

Read More >

Buy 1 Month

Get 3 Months!

Special Offer:

Trade Recommendations

Unleash the power of deversified trading with our comprehensive portfolio, covering:

  • Stock Trades
  • Crypto Trades
  • Forex Trades
  • Commodity Trades
Elliott Wave Analysis

Gain a competive edge with expert insights in to:

  • Global Indices
  • US Stocks & ASX Stocks
  • Forex & Crypto
  • Commodities
Top-Notch Trading Tools

Equip yourself with the tools of success:

  • Social Chat
  • Elliott Wave Algorithm
  • Screener
  • TradingLevels
  • Trading Game
7 Elliott Wave Analysts

Stay ahead of the market with daily charts and insightful videos
-Your secret to strategic trading!

JOIN HERE


Welcome to TradingLounge (ASIC A.R.No. 321187), specialists in trades, trading education and technical analysis, covering stocks, indices, commodities, forex and cryptocurrencies.

When you join TradingLounge you have access to everything we offer, including trade tools, educational content and a social platform to chat with like-minded investors.

Read more

@Copyright 2024 by tradinglounge.com

Contact Us

Australian no: 02 4787 6020

International no: +61 (2) 47876020

Pay with:

Find us on