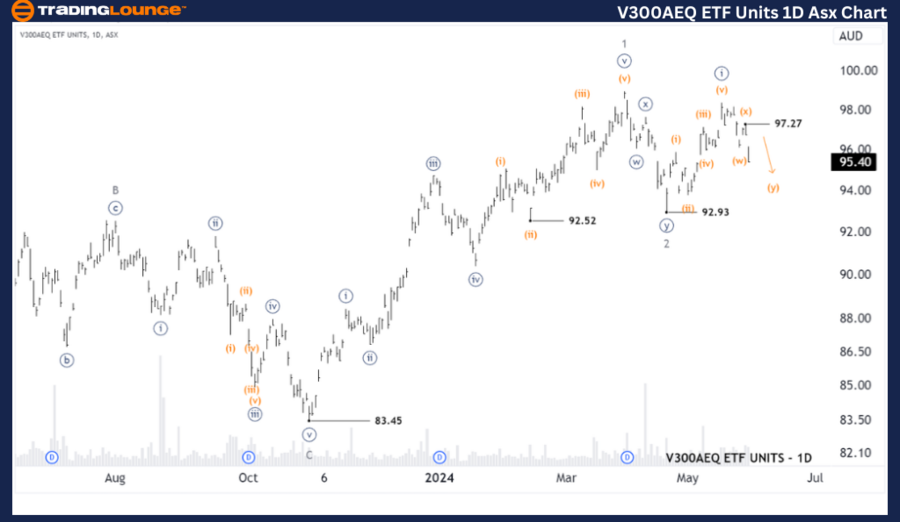
ASX: V300AEQ ETF UNITS – VAS Elliott Elliott Wave Technical Analysis TradingLounge (1D Chart)

Greetings, Our latest Elliott Wave analysis updates the Australian Stock Exchange (ASX) regarding V300AEQ ETF Units – VAS. We have confirmed the completion of wave 2-red and observed that wave 3-red is beginning its ascent.

ASX: V300AEQ ETF Units – VAS Elliott Wave Technical Analysis

1D Chart Analysis (Semilog Scale)

Function: Major trend (Minor degree, grey)

Mode: Motive

Structure: Impulse

Position: Wave (y)-orange of Wave ((ii))-navy of Wave 3-grey

Details: The short-term outlook indicates that wave 2-grey has completed, and wave 3-grey is currently unfolding. This wave is subdividing into wave ((i))-navy, which has completed a five-wave pattern and reached its peak. Now, wave ((ii))-navy is unfolding as a Double Zigzag. Once wave ((ii))-navy completes, a long trade setup will be in place to buy into wave ((iii))-navy of wave 3-grey.

Invalidation Point: 92.93

V300AEQ-ETF-Units-1D...


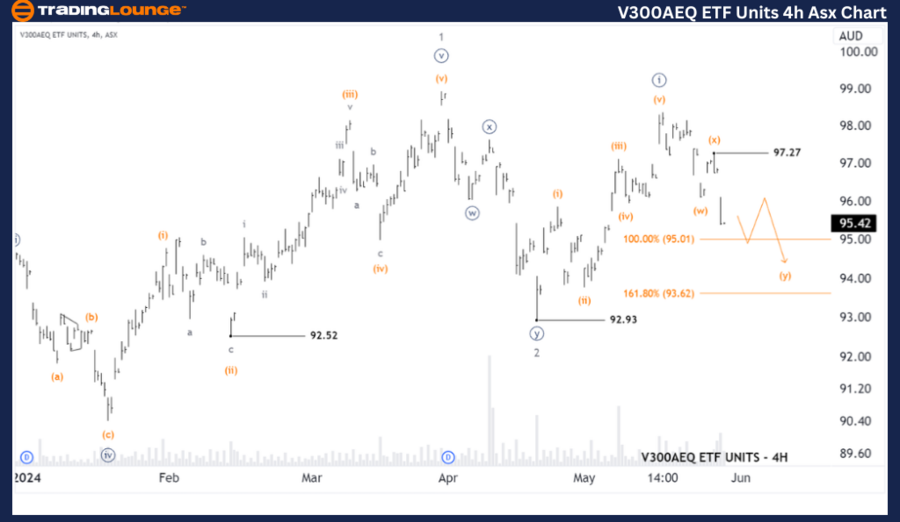
ASX: V300AEQ ETF Units – VAS Elliott Wave Technical Analysis (4-Hour Chart)

4-Hour Chart Analysis

Function: Major trend (Minute degree, navy)

Mode: Motive

Structure: Impulse

Position: Wave (y)-orange of Wave ((ii))-green

Details: The shorter-term outlook shows that wave ((i))-navy has ended after a five-wave subdivision. Wave ((ii))-navy is currently unfolding and pushing lower, developing as a Double Zigzag labeled (w), (x), (y)-orange. This movement is expected to find support in the 95.01 - 93.62 range. Once wave ((ii))-navy completes, a strong long trade setup targeting wave ((iii))-navy will emerge.

Invalidation Point: 92.93

Technical Analyst: Hua (Shane) Cuong, CEWA-M (Master’s Designation).

Source: visit Tradinglounge.com and learn From the Experts Join TradingLounge Here 

Previous: ASX: NEWS CORPORATION. – NWS Elliott Wave Technical Analysis

Special Trial Offer - 0.76 Cents a Day for 3 Months! Click here

Access 7 Analysts Over 170 Markets Covered. Chat Room With Support

V300AEQ-ETF-Units-4h...

Conclusion

Our analysis provides a detailed forecast of contextual trends and a short-term outlook for ASX: V300AEQ ETF Units – VAS. These insights help investors understand the current market trends and capitalize on them effectively. We offer specific price points that act as validation or invalidation signals for our wave count, enhancing confidence in our perspective. By combining these factors, we aim to provide the most objective and professional market trend analysis.

Related

Hindalco Industries Stock Forecast: Unlock Key Market Insights with Hindalco Stocks Elliott Wave Technical Analysis

Hindalco Industries Stock Forecast: Unlock Key Market Insights with Hindalco Stocks Elliott Wave Technical Analysis

This article provides an in-depth Elliott Wave analysis of Hindalco Industries, including detailed t...

Read More >
Exxon Mobil Inc.(XOM:NYSE) Elliott Wave Technical Analysis 9 January 24

Exxon Mobil Inc.(XOM:NYSE) Elliott Wave Technical Analysis 9 January 24

Exxon Mobil Corp.(XOM: NYSE) Elliott Wave Technical Analysis dated 4 January 24 with 4-Hour and 1-Ho...

Read More >
Bitcoin/U.S. dollar(BTCUSD) Elliott Wave Technical Analysis 23 October 23

Bitcoin/U.S. dollar(BTCUSD) Elliott Wave Technical Analysis 23 October 23

Bitcoin/U.S. dollar(BTCUSD) Elliott Wave Technical Analysis on 23 October 23 with BTCUSD Analysis Da...

Read More >
British Pound/ Australian Dollar(GBPAUD) Elliott Wave Technical Analysis 11 December 23

British Pound/ Australian Dollar(GBPAUD) Elliott Wave Technical Analysis 11 December 23

British Pound/Australian Dollar GBPAUD Elliott Wave Analysis Trading Lounge Day and 4-Hour Chart for...

Read More >
Understand Soybean Commodity Market with the Corrective Phase and Forecasted Price Targets Using Elliott Wave Technical Analysis

Understand Soybean Commodity Market with the Corrective Phase and Forecasted Price Targets Using Elliott Wave Technical Analysis

Explore an in-depth Elliott Wave analysis of Soybean prices, providing key insights into current mar...

Read More >
Euro/British Pound(EURGBP) 4 Hour Chart Elliott Wave Technical Analysis 15 November 23

Euro/British Pound(EURGBP) 4 Hour Chart Elliott Wave Technical Analysis 15 November 23

Euro/British Pound(EURGBP) 4 Hour Chart Elliott Wave Technical Analysis 15 November 23 offers an in-...

Read More >

Buy 1 Month

Get 3 Months!

Special Offer:

Trade Recommendations

Unleash the power of deversified trading with our comprehensive portfolio, covering:

  • Stock Trades
  • Crypto Trades
  • Forex Trades
  • Commodity Trades
Elliott Wave Analysis

Gain a competive edge with expert insights in to:

  • Global Indices
  • US Stocks & ASX Stocks
  • Forex & Crypto
  • Commodities
Top-Notch Trading Tools

Equip yourself with the tools of success:

  • Social Chat
  • Elliott Wave Algorithm
  • Screener
  • TradingLevels
  • Trading Game
7 Elliott Wave Analysts

Stay ahead of the market with daily charts and insightful videos
-Your secret to strategic trading!

JOIN HERE


Welcome to TradingLounge (ASIC A.R.No. 321187), specialists in trades, trading education and technical analysis, covering stocks, indices, commodities, forex and cryptocurrencies.

When you join TradingLounge you have access to everything we offer, including trade tools, educational content and a social platform to chat with like-minded investors.

Read more

@Copyright 2024 by tradinglounge.com

Contact Us

Australian no: 02 4787 6020

International no: +61 (2) 47876020

Pay with:

Find us on