GBPUSD Elliott Wave Analysis | Trading Lounge Daily Chart
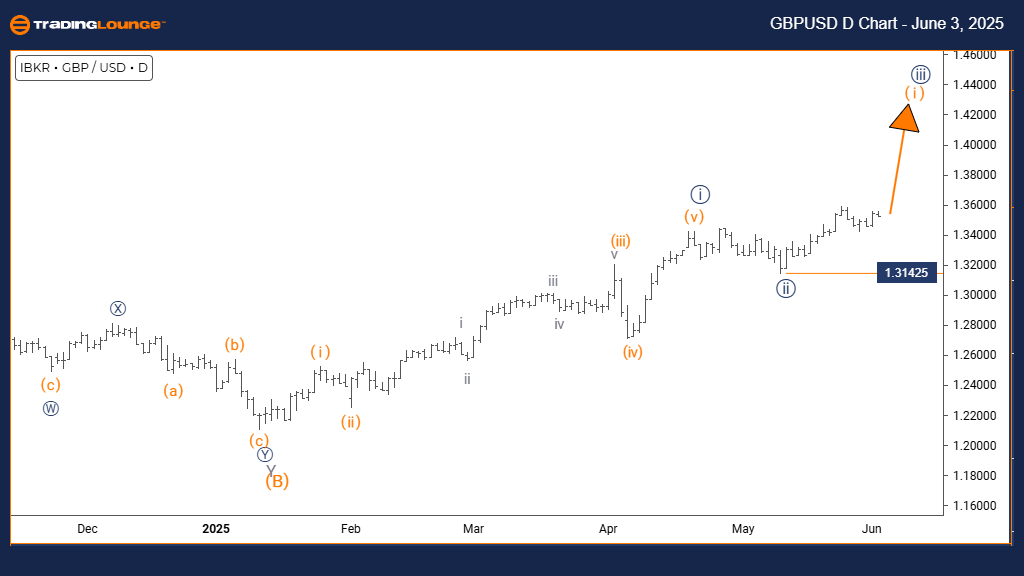
British Pound/ U.S. Dollar (GBPUSD) – Daily Chart Analysis
GBPUSD Elliott Wave Technical Overview
FUNCTION: Bullish Momentum
MODE: Impulsive Formation
STRUCTURE: Orange Wave 1
POSITION: Navy Blue Wave 3
DIRECTION (NEXT HIGHER DEGREE): Orange Wave 1 Initiated
KEY INSIGHT: Navy Blue Wave 2 likely completed; Orange Wave 1 of 3 in progress
INVALIDATION LEVEL: 1.31425
The GBPUSD daily chart outlines a strong bullish trend supported by an impulsive Elliott Wave pattern. The development of orange wave one signals the beginning of a new upward cycle within the larger navy blue wave three. With the corrective navy blue wave two phase presumed complete, momentum now shifts toward a sustained rally.
Technical confirmation supports the view that navy blue wave two has concluded, and orange wave one is advancing. This impulse reflects growing bullish sentiment. In the context of the daily timeframe, the pattern indicates extended upside potential. A break below the 1.31425 invalidation level would challenge this wave count and suggest a reassessment or a more complex correction.
This chart analysis situates GBPUSD at a crucial starting point within a projected long-term bullish trend. The formation of orange wave one marks the initial leg of navy blue wave three, hinting at prolonged upward movement. The forecast at the next higher wave degree is the continuation of orange wave one.
Traders are advised to monitor price movement closely to validate the impulsive structure and protect positions near the 1.31425 support level. While the overall wave pattern suggests a bullish outlook, breaching this threshold would alter the technical scenario. This daily Elliott Wave analysis emphasizes a strong bullish phase with potential for a sustained upward trend.
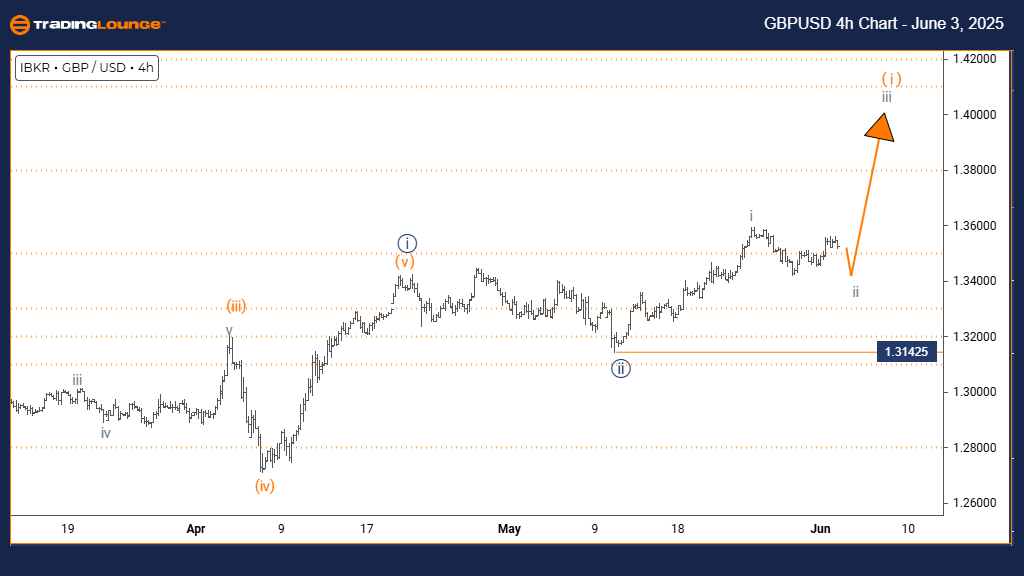
British Pound/ U.S. Dollar (GBPUSD) Forex Pair – TradingLounge 4-Hour Chart
GBPUSD Elliott Wave Technical Overview
FUNCTION: Counter-Trend Pullback
MODE: Corrective Structure
STRUCTURE: Gray Wave 2
POSITION: Within Orange Wave 1
DIRECTION (NEXT HIGHER DEGREE): Gray Wave 3
KEY INSIGHT: Gray Wave 1 completed; Gray Wave 2 correction unfolding
INVALIDATION LEVEL: 1.31425
On the 4-hour GBPUSD chart, price action reflects a corrective pullback within an ongoing bullish cycle. The wave count identifies gray wave two as an active retracement phase within the structure of orange wave one. This setup implies gray wave one’s upward leg has concluded, and the pair is temporarily consolidating.
Evidence supports the end of gray wave one, followed by the emergence of gray wave two’s corrective behavior. This short-term decline is anticipated to be limited, aligning with the broader bullish context. The invalidation level at 1.31425 remains a crucial support; a breakdown here would prompt a reevaluation of the current wave count.
This intraday analysis clarifies GBPUSD's positioning within its corrective cycle. Although short-term volatility may persist, gray wave two is seen as a consolidation phase before the bullish wave three resumes. Traders should stay alert to price signals that indicate the correction’s end and a potential upward breakout.
This 4-hour outlook highlights temporary corrective movement within a dominant uptrend. Traders are encouraged to manage risks and track patterns carefully as the market transitions into the next wave. The current wave behavior aligns with a broader bullish narrative rather than a bearish reversal.
Technical Analyst: Malik Awais
Source: Visit Tradinglounge.com and learn from the Experts. Join TradingLounge Here
Previous: GBPAUD Elliott Wave Technical Analysis
VALUE Offer - Buy 1 Month & Get 3 Months!Click here
Access 7 Analysts Over 200 Markets Covered. Chat Room With Support