10Jul

AMCOR Stock Forecast Using Elliott Wave Analysis Reveals Bullish Trend with Clear Price Targets and Key Support Levels (ASX:AMC)

AMCOR PLC – AMC Elliott Wave Technical Analysis | TradingLounge Review

Greetings,
Today's Elliott Wave analysis of AMCOR PLC (ASX:AMC) highlights a strong bullish trend. Our technical review identifies the initiation of a potential third impulse wave, signaling further upside potential. This report outlines key target price levels and the crucial invalidation point to assess the reliability of this forecast.

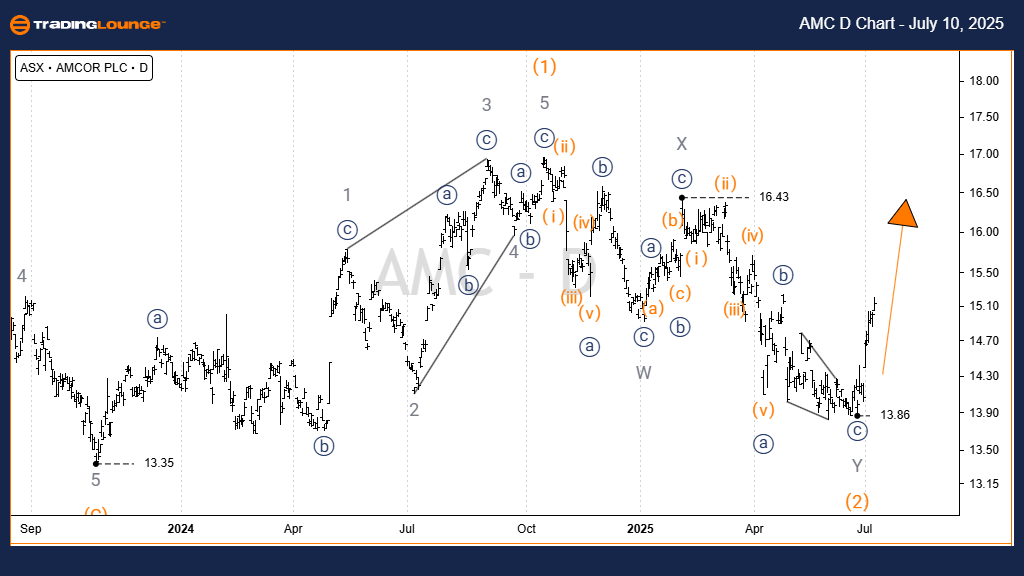
AMCOR PLC – AMC Daily Chart (1D) – Semilogarithmic Analysis

Function: Intermediate Trend Direction (Orange Degree)

Wave Mode: Motive

Wave Structure: Impulse

Wave Position: Wave 3) – Orange

Key Insights:

  • Wave 3) – orange appears to be developing from the 13.35 support level.
  • Within this wave, sub-wave 3)) – navy is extending with completed wave 1),2) – orange components.
  • The rally from 13.82 low supports an upward trajectory toward the 17.56–20.37 target range.
  • Sustaining above 13.82 is critical to confirm momentum toward wave 5)) – navy.

Invalidation Level: 13.86

AMC-ASX-Day-Chart-10...


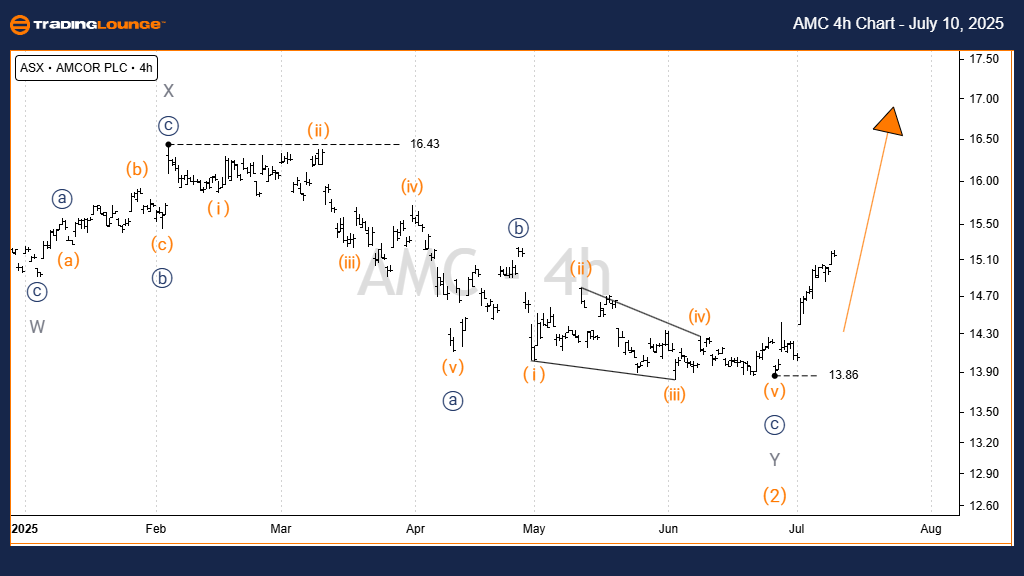
AMCOR PLC – AMC 4-Hour Chart Technical Analysis

Function: Intermediate Trend Confirmation (Orange Degree)

Wave Mode: Motive

Wave Structure: Impulse

Wave Position: Wave 3) – Orange

Technical Observations:

  • The uptrend remains active as AMC approaches the 16.43 resistance zone.
  • Price continuation above 13.86 is essential to validate this bullish structure.

Invalidation Level: 13.86

Technical Analyst: Hua (Shane) Cuong, CEWA‑M (Certified Elliott Wave Analyst – Master Level)

Source: Visit Tradinglounge.com and learn from the Experts. Join TradingLounge Here 

See Previous: MINERAL RESOURCES LIMITED – MIN Elliott Wave Technical Analysis

VALUE Offer - $1 for 2 Weeks then $29 a month!Click here

Access 7 Analysts Over 200 Markets Covered. Chat Room With Support

AMC-ASX-4h-Chart-100...


Conclusion:

This Elliott Wave forecast for AMCOR PLC (AMC) presents a technically grounded outlook for both long-term and short-term price action. Critical validation levels and price targets enhance confidence in this wave count. Our structured analysis supports traders with an informed and professional assessment of AMC stock's technical positioning.

Related

ASX Trading Success: SOUTH32 LIMITED (S32) Stock Analysis & Elliott Wave Technical Forecast

ASX Trading Success: SOUTH32 LIMITED (S32) Stock Analysis & Elliott Wave Technical Forecast

Our detailed Elliott Wave analysis covers the Australian Stock Exchange (ASX), featuring ASX Limited...

Read More >
Ethereum/ U.S. dollar(ETHUSD) Elliott Wave Technical Analysis 23 November 23

Ethereum/ U.S. dollar(ETHUSD) Elliott Wave Technical Analysis 23 November 23

TradingLounge Ethereum/ U.S. dollar(ETHUSD) Elliott Wave Technical Analysis Daily and 4-Hour Chart d...

Read More >
Elliott Wave Analysis of ASX:NWS Stock Forecast with Impulse and Corrective Wave Patterns for NEWS CORPORATION Traders

Elliott Wave Analysis of ASX:NWS Stock Forecast with Impulse and Corrective Wave Patterns for NEWS CORPORATION Traders

Elliott Wave breakdown of News Corporation (ASX:NWS), covering impulse and corrective wave patterns,...

Read More >
Insightful Day and 4-Hour Chart Review: British Pound/Japanese Yen(GBPJPY) Forex Elliott Wave Technical Analysis

Insightful Day and 4-Hour Chart Review: British Pound/Japanese Yen(GBPJPY) Forex Elliott Wave Technical Analysis

This comprehensive guide offers detailed GBPJPY trading analysis, focusing on Elliott Wave forecasts...

Read More >
Northern Star Resources NST Elliott Wave Technical Analysis to Help Guide Your Investment Decisions in the ASX Market

Northern Star Resources NST Elliott Wave Technical Analysis to Help Guide Your Investment Decisions in the ASX Market

Our detailed Elliott Wave analysis of Northern Star Resources (NST.ASX) highlights current market tr...

Read More >
Amazon Inc.(AMZN:NASDAQ) Elliott Wave Technical Analysis 25 October 23

Amazon Inc.(AMZN:NASDAQ) Elliott Wave Technical Analysis 25 October 23

Amazon Inc.(AMZN:NASDAQ) Elliott Wave Technical Analysis For 25 October 23 with 1-Hour and 4-Hour St...

Read More >

$1 for 2 Weeks

then $29 a month!

What a Special Offer!

Trade Recommendations

Unleash the power of deversified trading with our comprehensive portfolio, covering 250+ markets:

  • Stock Trades
  • Crypto Trades
  • Forex Trades
  • Commodity Trades
Elliott Wave Analysis

Gain a competitive edge with expert insights and AI-powered Elliott Wave charting into:

  • Global Indices
  • US Stocks & ASX Stocks
  • Forex & Crypto
  • Commodities
Top-Notch Trading Tools

Equip yourself with the tools of success:

  • Real-time Chat rooms
  • Elliott Wave Algorithm
  • Portfolio tools
  • TradingLevels
  • Screener
  • Trading Game
7 Elliott Wave Analysts

Stay ahead of the market with daily charts and insightful videos
Your secret to strategic trading!

JOIN HERE


Welcome to TradingLounge (ASIC A.R.No. 321187), specialists in trades, trading education and technical analysis, covering stocks, indices, commodities, forex and cryptocurrencies.

When you join TradingLounge you have access to everything we offer, including trade tools, educational content and a social platform to chat with like-minded investors.

Read more

@Copyright 2024 by tradinglounge.com

Contact Us

Australian no: 02 4787 6020

International no: +61 (2) 47876020

Pay with:

Find us on