26Jun

LINKUSD Elliott Wave Analysis Showing Chainlink Wave 2 Correction and Setup for Potential Wave 3 Breakout Above Resistance

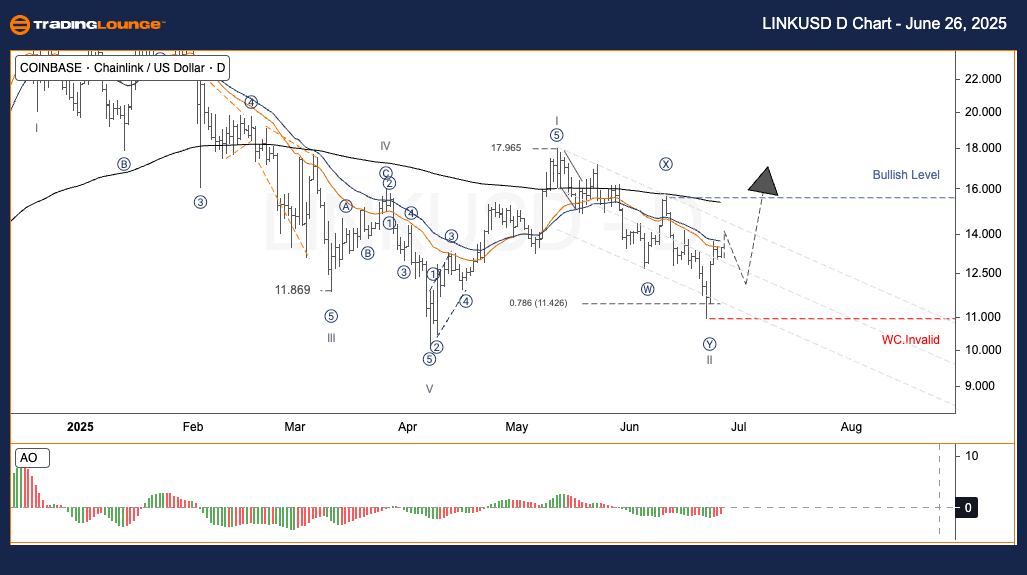
LINKUSD Elliott Wave Technical Analysis (Daily Chart)

LINKUSD Elliott Wave Technical Analysis

Function: Counter Trend

Mode: Corrective

Structure: Double Corrective

Position: Wave 2

Invalidation Level: Not defined

Chainlink (LINKUSD) Trading Strategy:
In the prior upward wave (Wave I), LINKUSD completed an Expanded Diagonal structure, topping out at $17.97. The subsequent pullback, classified as Wave II, followed a Double Zigzag pattern, reaching the 0.786 Fibonacci retracement level at $11.43.
Currently, prices are climbing in wave (1) and may be entering a corrective wave (2) before initiating wave (3), which could indicate a renewed bullish impulse.
A significant resistance level is located at $16.00, acting as a bullish confirmation point. If price action breaks above this zone, it could affirm a mid-term bullish trend for Chainlink.

Trading Strategy Highlights:
✅ Swing Trading (Short-term):

  • Wait until the current wave (2) consolidation concludes.
  • Position during wave (3) to capitalize on potential momentum.

🟥 Risk Management:

Monitor the $10.80 level as a potential invalidity zone to manage downside exposure.

LINKUSD-d-crypto-cha...


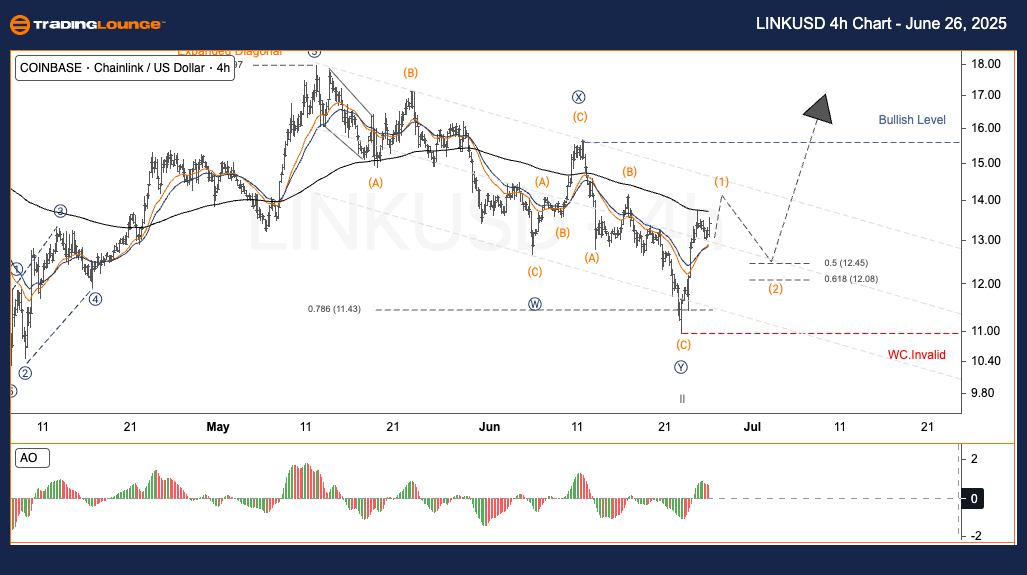
LINKUSD Elliott Wave Technical Analysis (4-Hour Chart)

Function: Counter Trend

Mode: Corrective

Structure: Double Corrective

Position: Wave 2

Invalidation Level: Not defined

Overview:
Mirroring the Daily Chart, Wave I peaked at $17.97, and the retracement in Wave II bottomed at $11.43, completing a Double Zigzag correction.
The current price activity suggests upward momentum in wave (1), with a likely minor pullback in wave (2) forming short-term.
The $16.00 resistance remains a crucial breakout level, which, if breached, supports the bullish case for wave (3) continuation.

✅ Swing Trade Strategy:

Stay patient until wave (2) ends to initiate new positions into wave (3).

🟥 Invalidation Zone: Near $10.80

Technical Analyst: Kittiampon Somboonsod, CEWA

Source: Visit Tradinglounge.com and learn from the Experts. Join TradingLounge Here

Previous: ETHUSD Elliott Wave Technical Analysis

VALUE Offer - Buy 1 Month & Get 3 Months!Click here

Access 7 Analysts Over 200 Markets Covered. Chat Room With Support

LINKUSD-4h-crypto-ch...

Related

Gain valuable insights XRP Crypto Price News Today XRPUSD Elliott Wave Technical Analysis

Gain valuable insights XRP Crypto Price News Today XRPUSD Elliott Wave Technical Analysis

Gain valuable insights into XRPUSD's market dynamics with technical analysis, Elliott Wave predi...

Read More >
BTCUSD Elliott Wave Analysis: Corrective Zigzag Pattern Unfolds - TradingLounge Insights 7 February 24

BTCUSD Elliott Wave Analysis: Corrective Zigzag Pattern Unfolds - TradingLounge Insights 7 February 24

Discover insights into BTCUSD Elliott Wave Analysis dated 7 February 24 by TradingLounge, delving in...

Read More >
Copper Elliott Wave Technical Analysis: Price Forecast, Key Levels, and Commodity Market Trends

Copper Elliott Wave Technical Analysis: Price Forecast, Key Levels, and Commodity Market Trends

This article provides a detailed Elliott Wave analysis of copper, highlighting key market trends, pr...

Read More >
Gold (XAUUSD) Elliott Wave Technical Analysis: Navigating Waves and Patterns for Market Insight

Gold (XAUUSD) Elliott Wave Technical Analysis: Navigating Waves and Patterns for Market Insight

In the intricate world of Elliott Wave analysis, the current outlook for gold suggests a zigzag patt...

Read More >
Cardano Price Prediction: ADAUSD Elliott Wave Analysis Suggests Strong Bullish Breakout and Rally Towards $1.00 Resistance Target

Cardano Price Prediction: ADAUSD Elliott Wave Analysis Suggests Strong Bullish Breakout and Rally Towards $1.00 Resistance Target

ADAUSD shows a bullish Elliott Wave 2 retracement; a breakout above $0.73 could trigger Cardano’s n...

Read More >
WTI Crudeoil Elliott Wave Analysis: Technical Chart Outlook, Market Trends, Support & Resistance Levels, and Trading Strategy

WTI Crudeoil Elliott Wave Analysis: Technical Chart Outlook, Market Trends, Support & Resistance Levels, and Trading Strategy

WTI Elliott Wave analysis, covering crude oil price trends, technical chart analysis, and potential ...

Read More >

$1 for 2 Weeks

then $29 a month!

What a Special Offer!

Trade Recommendations

Unleash the power of deversified trading with our comprehensive portfolio, covering 250+ markets:

  • Stock Trades
  • Crypto Trades
  • Forex Trades
  • Commodity Trades
Elliott Wave Analysis

Gain a competitive edge with expert insights and AI-powered Elliott Wave charting into:

  • Global Indices
  • US Stocks & ASX Stocks
  • Forex & Crypto
  • Commodities
Top-Notch Trading Tools

Equip yourself with the tools of success:

  • Real-time Chat rooms
  • Elliott Wave Algorithm
  • Portfolio tools
  • TradingLevels
  • Screener
  • Trading Game
7 Elliott Wave Analysts

Stay ahead of the market with daily charts and insightful videos
Your secret to strategic trading!

JOIN HERE


Welcome to TradingLounge (ASIC A.R.No. 321187), specialists in trades, trading education and technical analysis, covering stocks, indices, commodities, forex and cryptocurrencies.

When you join TradingLounge you have access to everything we offer, including trade tools, educational content and a social platform to chat with like-minded investors.

Read more

@Copyright 2024 by tradinglounge.com

Contact Us

Australian no: 02 4787 6020

International no: +61 (2) 47876020

Pay with:

Find us on