The Procter & Gamble Co. (PG) Elliott Wave Forecast | Trading Lounge Daily Chart
PG Elliott Wave Technical Analysis
Function: Identifying Market Trend
Mode: Impulsive Wave Movement
Structure: Motive Wave Formation
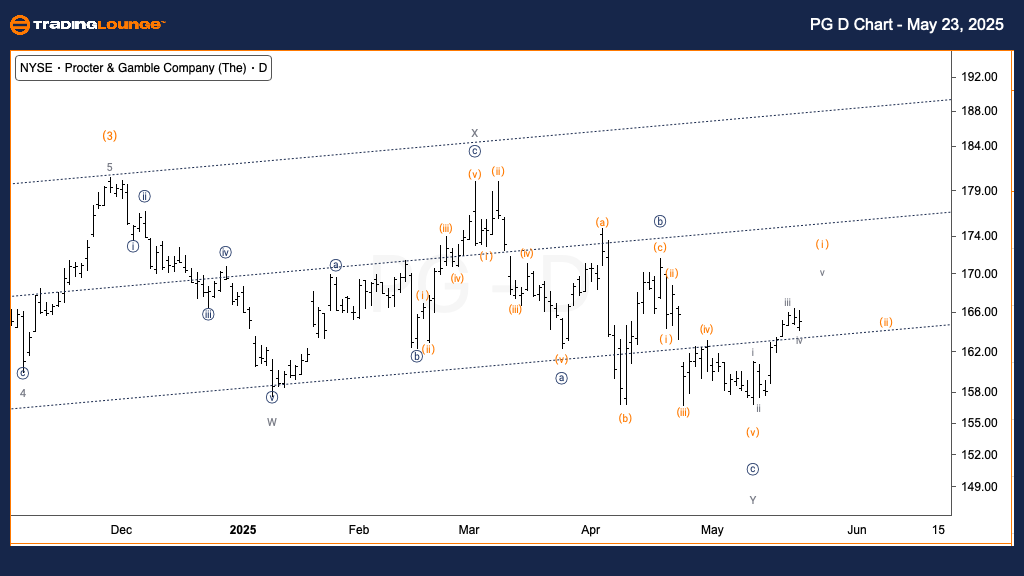
Position: Wave (i) of {i}
Direction: Bullish Trend in Wave (i)
Details:
Procter & Gamble stock (NYSE: PG) is demonstrating strong bullish momentum, having maintained support above the $150 medium price level. According to Elliott Wave theory, the asset is currently advancing in wave (i) of {i}, suggesting further gains. The next target is the Minor Group 2 resistance zone, which starts around the $165 level, indicating continued upward movement.
The Procter & Gamble Co. (PG) Elliott Wave Forecast | Trading Lounge 1-Hour Chart
PG Elliott Wave Technical Analysis
Function: Trend Continuation Signal
Mode: Impulsive Pattern
Structure: Motive Formation
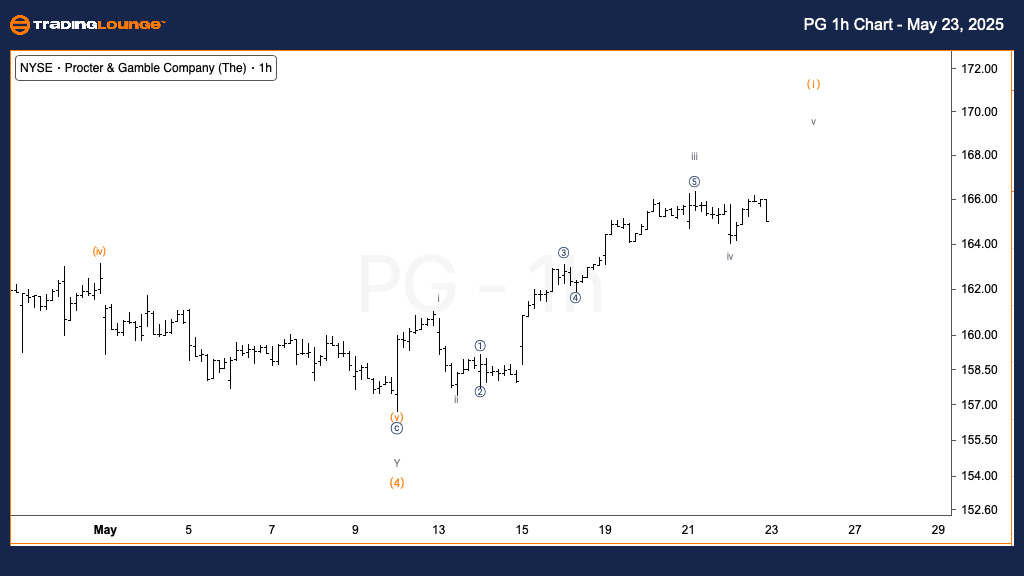
Position: Wave iv of (i)
Direction: Progression into Wave v
Details:
On the hourly chart, Procter & Gamble appears to be completing wave iv. If support holds at current levels, wave v of (i) could initiate, potentially triggering a bullish breakout near the $165 resistance area. A confirmed rise beyond this level would reinforce the positive trend setup.
Technical Analyst: Alessio Barretta
Source: Visit Tradinglounge.com and learn from the Experts. Join TradingLounge Here
Previous: QUALCOMM Inc. (QCOM) Elliott Wave Technical Analysis
VALUE Offer - Buy 1 Month & Get 3 Months!Click here
Access 7 Analysts Over 200 Markets Covered. Chat Room With Support
Overview
This Elliott Wave analysis of Procter & Gamble (PG) on both daily and intraday charts highlights a potential continuation of the bullish trend. Sustained movement above critical resistance zones like $165 could confirm further upward trajectory for PG stock.