23May

Dr Reddy's Laboratories: Comprehensive Elliott Wave Analysis Reveals Bullish Trends and Key Support Levels for Strategic Trading

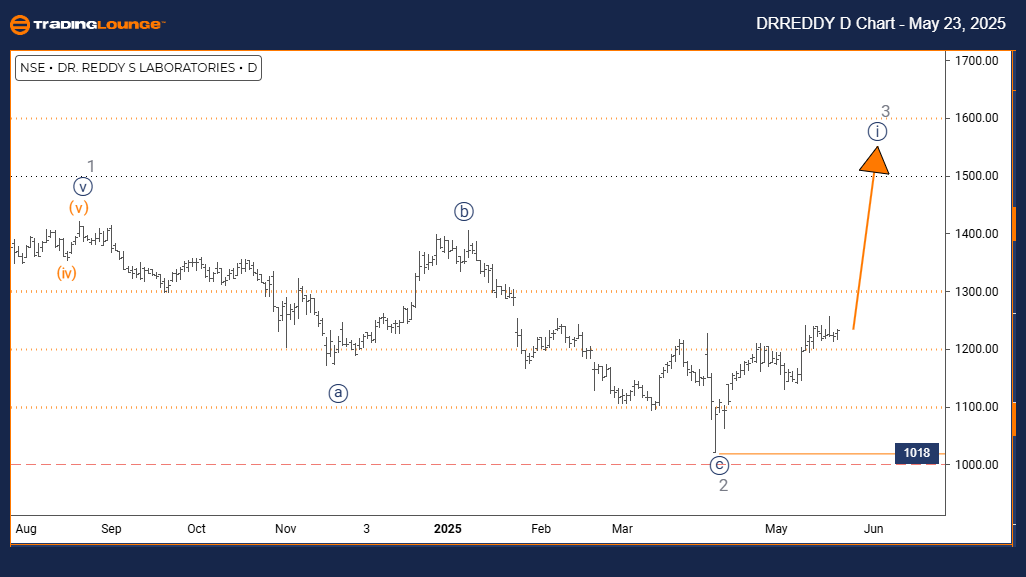
Dr Reddy’s Laboratories Elliott Wave Forecast – Trading Lounge Daily Chart

Dr Reddy’s Laboratories Daily Chart Analysis

Dr Reddy’s Laboratories Elliott Wave Technical Overview

Trend Function: Bullish Continuation

Wave Mode: Impulsive Structure

Wave Structure: Primary Wave 1 (Navy Blue)

Wave Position: Intermediate Wave 3 (Gray)

Next Higher Degree Direction: Initiation of Primary Wave 1

Key Insights: Intermediate Wave 2 (Gray) appears to have concluded; currently observing the development of Primary Wave 1 within Intermediate Wave 3.

Critical Invalidation Level: 1018 INR

The daily Elliott Wave analysis for Dr Reddy’s Laboratories suggests strong bullish momentum with the stock entering an impulsive rally. Primary Wave 1 is actively unfolding inside the broader Intermediate Wave 3, signaling a shift from the corrective structure of Intermediate Wave 2.

This bullish configuration reflects renewed upward pressure, supporting a potential sustained rally. The impulsive behavior of this wave indicates strong buying sentiment. The bullish forecast remains valid as long as prices stay above the 1018 INR level. A drop below this threshold would necessitate a reanalysis of the wave structure.

Key Takeaways:

  • Strong upside potential with impulsive momentum
  • Strategic point of invalidation set at 1018 INR
  • Traders should observe for bullish confirmation signals and manage risk accordingly

DRREDDY-Indian-Stock...


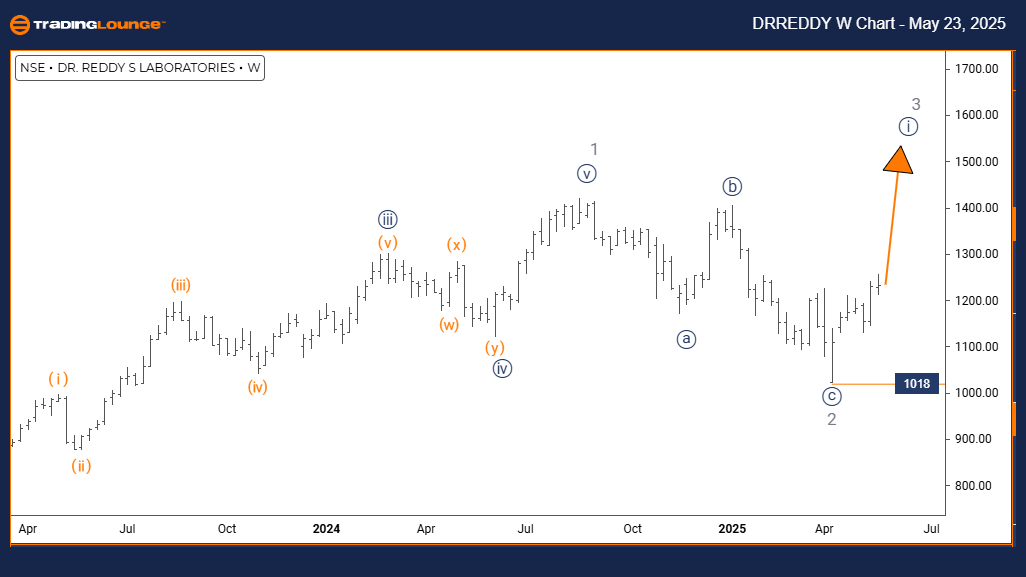
DR REDDY LABORATORIES Stock Analysis – Weekly Chart

Dr Reddy’s Laboratories Elliott Wave Technical Overview

Trend Function: Sustained Bullish Bias

Wave Mode: Impulsive Advance

Wave Structure: Primary Wave 1 (Navy Blue)

Wave Position: Intermediate Wave 3 (Gray)

Next Lower Degree Direction: Development of Primary Wave 2

Key Insights: Intermediate Wave 2 has likely completed; Primary Wave 1 is progressing within Intermediate Wave 3.

Critical Invalidation Level: 1018 INR

The weekly Elliott Wave analysis supports a strong bullish trend for Dr Reddy’s Laboratories. The ongoing impulsive structure, with Primary Wave 1 advancing in Intermediate Wave 3, underscores the end of the previous corrective phase and the start of a new bullish cycle.

This wave alignment indicates potential for a continued upward extension, often supported by institutional demand. The forecast remains intact while prices hold above the 1018 INR mark. Falling below this level would invalidate the current wave scenario and prompt a reevaluation.

Key Takeaways:

  • Long-term bullish scenario remains in play
  • Potential upcoming development of a corrective Primary Wave 2
  • Continuous monitoring of support zones and wave validation levels advised

Technical Analyst: Malik Awais

Source: Visit Tradinglounge.com and learn from the Experts. Join TradingLounge Here 

Previous: BHARAT ELECTRONICS Elliott Wave Technical Analysis

VALUE Offer - Buy 1 Month & Get 3 Months!Click here

Access 7 Analysts Over 200 Markets Covered. Chat Room With Support

DRREDDY-Indian-Stock...

Related

Complete Elliott Wave Technical Analysis for RUSSELL 2000 Index: RUT index Market Analysis | Best Russell 2000 stocks

Complete Elliott Wave Technical Analysis for RUSSELL 2000 Index: RUT index Market Analysis | Best Russell 2000 stocks

The Russell 2000 Elliott Wave analysis provides a comprehensive look at the market's current tre...

Read More >
Insights into ICICI Bank's Stock Performance and Future Price Movements: ICICIBANK Elliott Wave Technical Analysis

Insights into ICICI Bank's Stock Performance and Future Price Movements: ICICIBANK Elliott Wave Technical Analysis

This article provides a comprehensive Elliott Wave analysis of ICICI Bank's stock, detailing pot...

Read More >
Elliott Wave Analysis for MINERAL RESOURCES LIMITED – MIN Reveals Strong Wave 5 Setup, Support at $14.05

Elliott Wave Analysis for MINERAL RESOURCES LIMITED – MIN Reveals Strong Wave 5 Setup, Support at $14.05

Elliott Wave analysis for Mineral Resources Limited (ASX:MIN) reveals a completed Wave 4 correction...

Read More >
RUSSELL 2000 Index Elliott Wave Technical Analysis: Best Stocks to buy and Market Forecasts

RUSSELL 2000 Index Elliott Wave Technical Analysis: Best Stocks to buy and Market Forecasts

This article offers an in-depth Elliott Wave analysis of the Russell 2000, providing valuable insigh...

Read More >
Ethereum Elliott Wave Analysis: Detailed ETHUSD Price Prediction, Support & Resistance Levels, and Market Trends

Ethereum Elliott Wave Analysis: Detailed ETHUSD Price Prediction, Support & Resistance Levels, and Market Trends

Ethereum Elliott Wave analysis to understand ETH/USD price trends, key support and resistance levels...

Read More >

$1 for 2 Weeks

then $29 a month!

What a Special Offer!

Trade Recommendations

Unleash the power of deversified trading with our comprehensive portfolio, covering 250+ markets:

  • Stock Trades
  • Crypto Trades
  • Forex Trades
  • Commodity Trades
Elliott Wave Analysis

Gain a competitive edge with expert insights and AI-powered Elliott Wave charting into:

  • Global Indices
  • US Stocks & ASX Stocks
  • Forex & Crypto
  • Commodities
Top-Notch Trading Tools

Equip yourself with the tools of success:

  • Real-time Chat rooms
  • Elliott Wave Algorithm
  • Portfolio tools
  • TradingLevels
  • Screener
  • Trading Game
7 Elliott Wave Analysts

Stay ahead of the market with daily charts and insightful videos
Your secret to strategic trading!

JOIN HERE


Welcome to TradingLounge (ASIC A.R.No. 321187), specialists in trades, trading education and technical analysis, covering stocks, indices, commodities, forex and cryptocurrencies.

When you join TradingLounge you have access to everything we offer, including trade tools, educational content and a social platform to chat with like-minded investors.

Read more

@Copyright 2024 by tradinglounge.com

Contact Us

Australian no: 02 4787 6020

International no: +61 (2) 47876020

Pay with:

Find us on