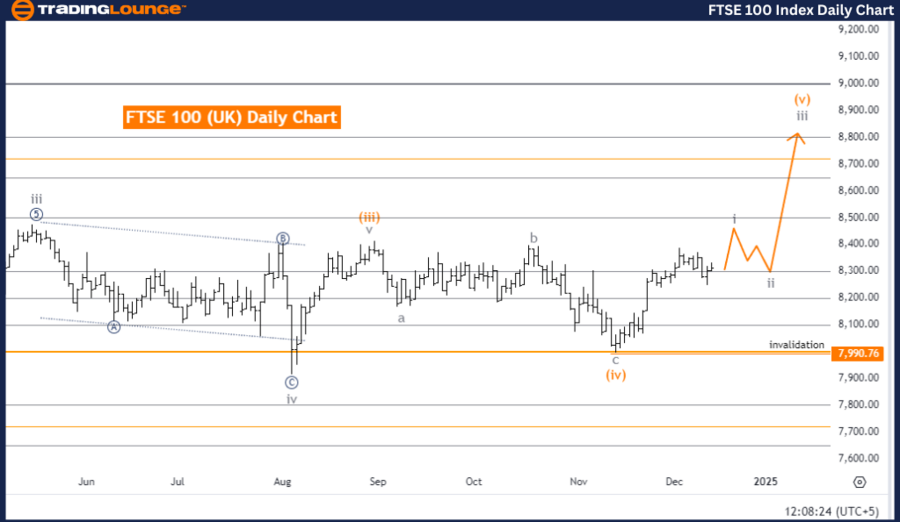
FTSE 100 (UK) Elliott Wave Analysis Trading Lounge Day Chart
Function: Trend
Mode: Impulsive
Structure: Gray Wave 1
Position: Orange Wave 5
Direction for Next Lower Degrees: Gray Wave 2
Details
Current Status:
- Orange wave 4 is complete.
- Gray wave 1 of orange wave 5 is actively progressing.
- Invalidation Level: 7,990.76 (A drop below this level invalidates the current Elliott Wave structure).
Analysis Overview
The FTSE 100 daily chart showcases a bullish trend, analyzed using Elliott Wave principles. The impulsive mode indicates strong upward momentum within the current wave sequence.
Key Highlights:
Wave Progression:
- Completion of orange wave 4 transitions into gray wave 1 of orange wave 5.
- Gray wave 1 initiates a fresh impulsive sequence, continuing the bullish trend.
Upward Momentum:
- Gray wave 1 is propelling prices higher, backed by strong bullish sentiment.
Upcoming Correction:
- After gray wave 1, a corrective phase is expected in gray wave 2.
Key Considerations
Bullish Sentiment:
- The completion of orange wave 4 and the start of gray wave 1 signify robust upward momentum.
Potential Reassessment:
- A drop below 7,990.76 would invalidate the current Elliott Wave count, necessitating a revised analysis.
Strategic Implications for Traders
Capitalizing on the Trend:
- Align trading strategies with the bullish momentum of gray wave 1 within orange wave 5.
Preparing for Gray Wave 2:
- Anticipate a potential correction in gray wave 2 to manage positions effectively.
Monitoring Progression:
- Closely track price movements and wave developments for informed decisions.
This analysis reflects a strong bullish outlook for the FTSE 100 daily chart. The active phase of gray wave 1 provides opportunities for traders to benefit from the prevailing upward momentum.
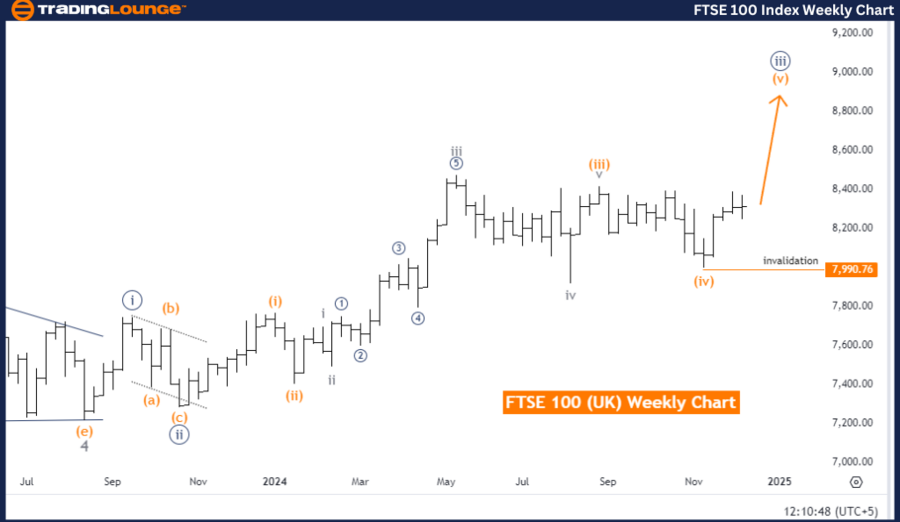
FTSE 100 (UK) Elliott Wave Analysis Trading Lounge Weekly Chart
FTSE 100 (UK) Elliott Wave Technical Analysis
Function: Trend
Mode: Impulsive
Structure: Orange Wave 5
Position: Navy Blue Wave 3
Direction for Next Lower Degrees: Navy Blue Wave 4
Details
Current Status:
- Orange wave 4 is complete.
- Orange wave 5 is progressing within navy blue wave 3.
- Invalidation Level: 7,990.76 (A drop below this level invalidates the current Elliott Wave structure).
Analysis Overview
The FTSE 100 weekly chart highlights a bullish trend, underpinned by Elliott Wave analysis. The impulsive mode indicates sustained upward momentum within the current wave structure.
Key Highlights:
Wave Progression:
- Completion of orange wave 4 transitions into orange wave 5, the final phase of the impulsive sequence.
- The market remains within navy blue wave 3, reinforcing bullish sentiment.
Final Impulsive Phase:
- Orange wave 5 represents the culmination of the upward trend, marking the peak of this phase.
Upcoming Correction:
- After orange wave 5 and navy blue wave 3, a corrective phase is anticipated in navy blue wave 4.
Key Considerations
Bullish Sentiment:
- Orange wave 5’s progression within navy blue wave 3 indicates sustained upward momentum.
Potential Reassessment:
- Prices below 7,990.76 invalidate the current wave count and require a revised analysis.
Strategic Implications for Traders
Trend-Following Opportunities:
- Orange wave 5 presents opportunities to capitalize on the bullish momentum during this market phase.
Preparing for Navy Blue Wave 4:
- Anticipate the corrective phase following navy blue wave 3 to manage risk effectively.
Monitoring Progression:
- Continuously observe price action and wave developments for accurate decision-making.
This analysis emphasizes a bullish outlook for the FTSE 100 weekly chart. Traders can align strategies with the ongoing orange wave 5 momentum while preparing for eventual corrective phases.
Technical Analyst: Malik Awais
Source: visit Tradinglounge.com and learn From the Experts Join TradingLounge Here
Previous: DAX (Germany) Elliott Wave Technical Analysis
VALUE Offer - Buy 1 Month & Get 3 Months!Click here
Access 7 Analysts Over 200 Markets Covered. Chat Room With Support