02Nov

Natural Gas Commodity Elliott Wave Technical Analysis: Covering Critical Resistance Levels, Wave Patterns, and Expected Market Trends

Natural Gas Elliott Wave Technical Analysis

Natural Gas Elliott Wave Analysis

The natural gas market's late October recovery remains steady, with the commodity in a sideways price structure since April 2023. Currently, there’s potential for prices to test the highs from October and June 2024, aiming to retest peak levels observed in January 2024 and October 2023.

Long-Term Analysis: Bearish Impulse Wave and Correction

Natural gas concluded a significant bearish impulse wave sequence from a high of $10 in August 2022, dropping sharply to around $1.5 in February 2024. This massive decline aligns with Elliott Wave principles, where a 5-wave trend is typically followed by a 3-wave correction. Based on this, the current correction could push prices up to a potential range of $4.79–$5.8, retracing the bearish trend from August 2022.

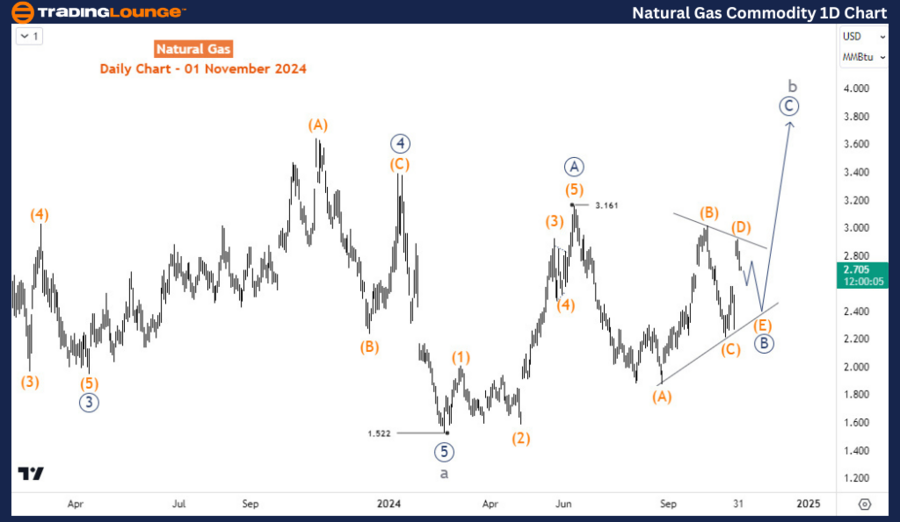
Natural Gas Commodity Daily Chart Outlook: Zigzag Correction Structure

On the daily timeframe, the corrective phase began at a low of 1.522, forming a primary degree zigzag structure. Wave ((A)) completed as an impulse, reaching 3.16 in June 2024. Following this, a sideways movement has taken shape, indicating a potential triangle structure for wave ((B)). Once wave ((B)) finalizes, wave ((C)) could push towards $4 or higher, extending the corrective rally.

Natural-Gas-Commodit...


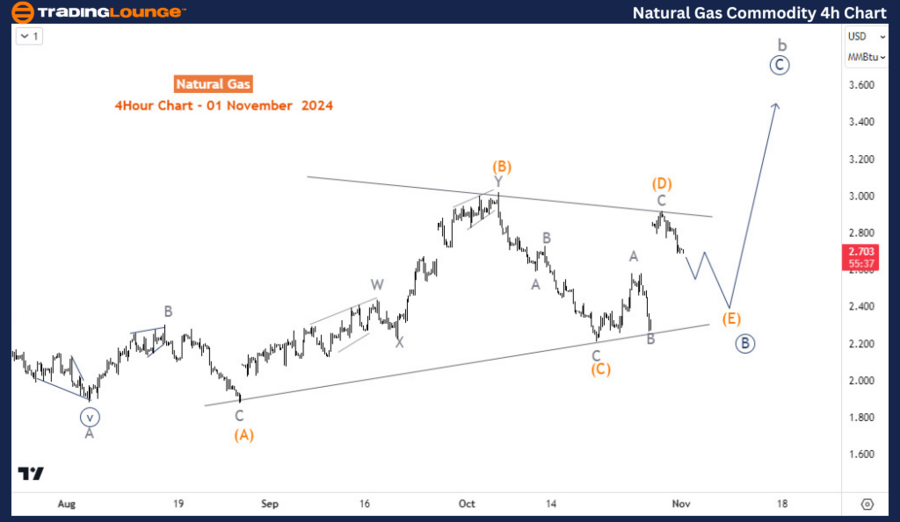
Natural Gas Commodity H4 Chart: Completing Wave (E) of ((B))

The H4 chart suggests wave (E) of ((B)) remains unfinished, indicating that a pullback from late October may dip further into the 2.47–2.35 range before completing wave (E). Upon this wave’s completion, prices are expected to resume the upward correction that began in February, aligning with bullish momentum for the next phase.

Technical Analyst: Sanmi Adeagbo

Source: visit Tradinglounge.com and learn From the Experts Join TradingLounge Here 

See Previous: Cocoa Commodity Elliott Wave Technical Analysis

VALUE Offer - Buy 1 Month & Get 3 Months!Click here

Access 7 Analysts Over 200 Markets Covered. Chat Room With Support

Natural-Gas-Commodit...

Related

Unveiling Advanced Trading Strategies and Stock Predictions: Analog Devices Inc.(ADI) Stocks Elliott Wave Technical Analysis

Unveiling Advanced Trading Strategies and Stock Predictions: Analog Devices Inc.(ADI) Stocks Elliott Wave Technical Analysis

This article provides a thorough Elliott Wave analysis for Analog Devices Inc. (ADI), offering insig...

Read More >
Elliott Wave Trading Strategies for SP500, NASDAQ 100 & Leading Tech Stocks

Elliott Wave Trading Strategies for SP500, NASDAQ 100 & Leading Tech Stocks

Major indices and tech stocks, including SP500, NASDAQ 100, Apple, Tesla, Amazon, and Bitcoin, are c...

Read More >
ADANI ENTERPRISES - ADANIENT Elliott Wave Correction Set-Up Ahead of Bullish Orange Wave 3 Technical Breakout Guidance

ADANI ENTERPRISES - ADANIENT Elliott Wave Correction Set-Up Ahead of Bullish Orange Wave 3 Technical Breakout Guidance

Daily and weekly Elliott Wave breakdowns show ADANI Enterprises in Gray Wave C of a counter-trend c...

Read More >
Euro/British Pound(EURGBP) Forex Elliott Wave Technical Analysis: A Comprehensive Overview for Traders

Euro/British Pound(EURGBP) Forex Elliott Wave Technical Analysis: A Comprehensive Overview for Traders

This article provides an in-depth Elliott Wave analysis of the EURGBP currency pair, highlighting ke...

Read More >
NVIDIA Corp. (NVDA) Stocks Elliott Wave Technical Analysis: Price Forecast and Technical Trends

NVIDIA Corp. (NVDA) Stocks Elliott Wave Technical Analysis: Price Forecast and Technical Trends

This article provides an in-depth Elliott Wave analysis of NVIDIA Corp. (NVDA) stock, outlining curr...

Read More >
NEOUSD Elliott Wave Technical Analysis: Where we break down NEO's Price Movements, Trading Strategies, and Key Indicators

NEOUSD Elliott Wave Technical Analysis: Where we break down NEO's Price Movements, Trading Strategies, and Key Indicators

Explore the comprehensive NEOUSD Elliott Wave analysis, where we break down NEO's price movement...

Read More >

$1 for 2 Weeks

then $29 a month!

What a Special Offer!

Trade Recommendations

Unleash the power of deversified trading with our comprehensive portfolio, covering 250+ markets:

  • Stock Trades
  • Crypto Trades
  • Forex Trades
  • Commodity Trades
Elliott Wave Analysis

Gain a competitive edge with expert insights and AI-powered Elliott Wave charting into:

  • Global Indices
  • US Stocks & ASX Stocks
  • Forex & Crypto
  • Commodities
Top-Notch Trading Tools

Equip yourself with the tools of success:

  • Real-time Chat rooms
  • Elliott Wave Algorithm
  • Portfolio tools
  • TradingLevels
  • Screener
  • Trading Game
7 Elliott Wave Analysts

Stay ahead of the market with daily charts and insightful videos
Your secret to strategic trading!

JOIN HERE


Welcome to TradingLounge (ASIC A.R.No. 321187), specialists in trades, trading education and technical analysis, covering stocks, indices, commodities, forex and cryptocurrencies.

When you join TradingLounge you have access to everything we offer, including trade tools, educational content and a social platform to chat with like-minded investors.

Read more

@Copyright 2024 by tradinglounge.com

Contact Us

Australian no: 02 4787 6020

International no: +61 (2) 47876020

Pay with:

Find us on