ASX: V300AEQ ETF UNITS – VAS Elliott Wave Technical Analysis TradingLounge (1D Chart)

Greetings, our Elliott Wave analysis today updates the Australian Stock Exchange (ASX) with V300AEQ ETF UNITS – VAS. We observe wave 2-grey moving slightly lower, with wave 3-grey potentially returning later to push higher. I will be monitoring and looking for a Long Trade Setup.

ASX: V300AEQ ETF UNITS – VAS Elliott Wave Technical Analysis

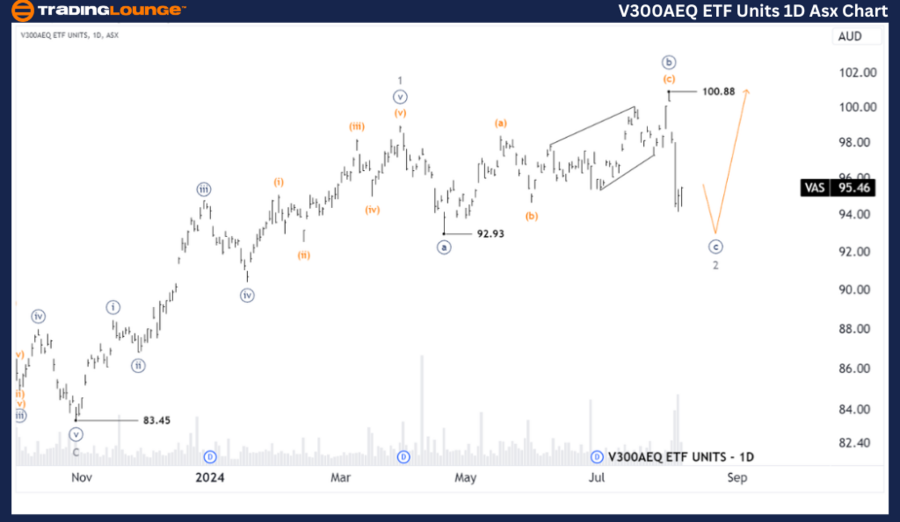
ASX: V300AEQ ETF UNITS – VAS 1D Chart (Semilog Scale) Analysis

Function: Major trend (Minor degree, grey)

Mode: Motive

Structure: Impulse

Position: Wave ((C))-navy of Wave 2-grey

Details: Wave count is updated to increase probability. Wave 2-grey opened as an Expanded Flat, with wave ((b))-navy completing at the high of 100.88. Wave ((c))-navy is pushing lower and may find support around 92.93, with wave 3-grey potentially moving higher afterward.

Invalidation point: 83.45

V300AEQ-ETF-UNITS-1d...


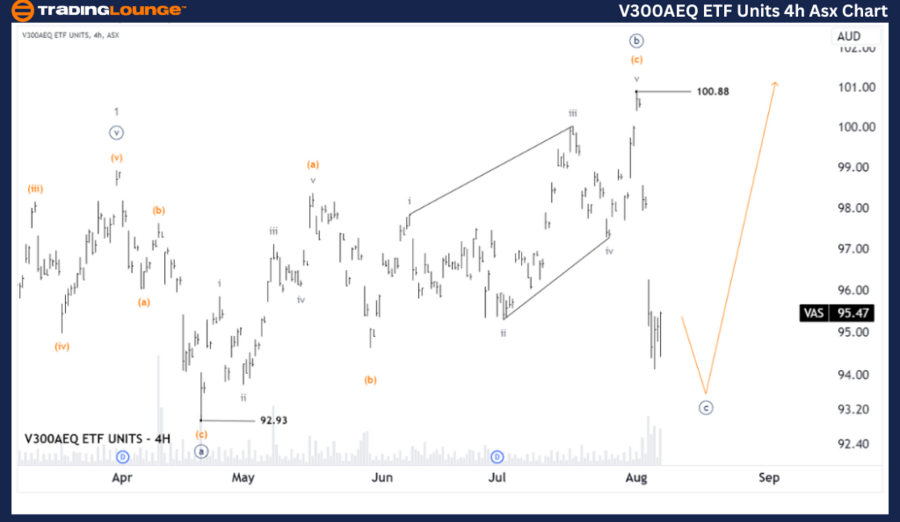
ASX: V300AEQ ETF UNITS – VAS Elliott Wave Technical Analysis TradingLounge (4-Hour Chart)

ASX: V300AEQ ETF UNITS – VAS Elliott Wave Technical Analysis

ASX: V300AEQ ETF UNITS – VAS 4-Hour Chart Analysis

Function: Counter trend (Minute degree, navy)

Mode: Corrective

Structure: Flat

Position: Wave ((c))-navy

Details: Wave 2-grey opens as an Expanded Flat, with wave ((c))-navy pushing lower, potentially nearing the low area at 92.93. I will look for evidence when the Flat wave ends and seek a Long Trade Setup afterward.

Invalidation point: 100.88

Conclusion:

Our analysis and forecast of contextual trends, alongside the short-term outlook for ASX: V300AEQ ETF UNITS – VAS, aim to provide readers with insights into current market trends and how to capitalize on them effectively. We offer specific price points that act as validation or invalidation signals for our wave count, enhancing confidence in our perspective. By combining these factors, we strive to offer readers the most objective and professional perspective on market trends.

Technical Analyst: Hua (Shane) Cuong, CEWA-M (Master’s Designation).

Source: visit Tradinglounge.com and learn From the Experts Join TradingLounge Here 

Previous:  SANTOS LIMITED - STO Elliott Wave Technical Analysis 

Special Trial Offer - 0.76 Cents a Day for 3 Months! Click here

Access 7 Analysts Over 170 Markets Covered. Chat Room With Support

V300AEQ-ETF-UNITS-4h...

Related

Berkshire Hathaway Inc.(BRK.B:NYSE) Elliott Wave Technical Analysis 22 November 23

Berkshire Hathaway Inc.(BRK.B:NYSE) Elliott Wave Technical Analysis 22 November 23

Stock Berkshire Hathaway Inc.(BRK.B: NYSE) Elliott Wave Technical Analysis 1-hour and 4-hour Chart d...

Read More >
Russell 2000 Index Elliott Wave Analysis Shows Strong Bullish Trend Setup with Indicating Early Momentum in a Long-term Upward Trend

Russell 2000 Index Elliott Wave Analysis Shows Strong Bullish Trend Setup with Indicating Early Momentum in a Long-term Upward Trend

This analysis reveals a bullish Elliott Wave structure in the Russell 2000 index, indicating early m...

Read More >
Bearish trend remains intact Soybeans Commodities charts Elliott Wave Technical Analysis

Bearish trend remains intact Soybeans Commodities charts Elliott Wave Technical Analysis

In summary, the Elliott Wave analysis of Soybeans Commodities charts indicates a persistent bearish ...

Read More >
DOW JONES Elliott Wave Forecast Reveals Bullish Impulse Structure on DJI Daily and Weekly Charts With Key Price Support

DOW JONES Elliott Wave Forecast Reveals Bullish Impulse Structure on DJI Daily and Weekly Charts With Key Price Support

Elliott Wave analysis of the DOW JONES (DJI), highlighting bullish trends in daily and weekly charts...

Read More >
Elliott Wave XLE SPDR Energy Select Sector ETF Analysis Reveals Bullish Energy ETF Forecast and Key Trading Strategy for 2025 Investors

Elliott Wave XLE SPDR Energy Select Sector ETF Analysis Reveals Bullish Energy ETF Forecast and Key Trading Strategy for 2025 Investors

This technical overview of XLE applies Elliott Wave analysis to project upcoming movements in the SP...

Read More >
Ethereum (ETHUSD) Elliott Wave Analysis Predicts $2,478 Target as Wave 3 Begins – ETH Price Forecast and Trading Strategy Included

Ethereum (ETHUSD) Elliott Wave Analysis Predicts $2,478 Target as Wave 3 Begins – ETH Price Forecast and Trading Strategy Included

Ethereum resumes its bullish trend with wave (3) in play. Elliott Wave analysis shows $2,478 as the ...

Read More >

$1 for 2 Weeks

then $29 a month!

What a Special Offer!

Trade Recommendations

Unleash the power of deversified trading with our comprehensive portfolio, covering 250+ markets:

  • Stock Trades
  • Crypto Trades
  • Forex Trades
  • Commodity Trades
Elliott Wave Analysis

Gain a competitive edge with expert insights and AI-powered Elliott Wave charting into:

  • Global Indices
  • US Stocks & ASX Stocks
  • Forex & Crypto
  • Commodities
Top-Notch Trading Tools

Equip yourself with the tools of success:

  • Real-time Chat rooms
  • Elliott Wave Algorithm
  • Portfolio tools
  • TradingLevels
  • Screener
  • Trading Game
7 Elliott Wave Analysts

Stay ahead of the market with daily charts and insightful videos
Your secret to strategic trading!

JOIN HERE


Welcome to TradingLounge (ASIC A.R.No. 321187), specialists in trades, trading education and technical analysis, covering stocks, indices, commodities, forex and cryptocurrencies.

When you join TradingLounge you have access to everything we offer, including trade tools, educational content and a social platform to chat with like-minded investors.

Read more

@Copyright 2024 by tradinglounge.com

Contact Us

Australian no: 02 4787 6020

International no: +61 (2) 47876020

Pay with:

Find us on