ETHUSD Elliott Wave Analysis – TradingLounge Daily Chart
Ethereum / U.S. Dollar (ETHUSD) Daily Chart Analysis
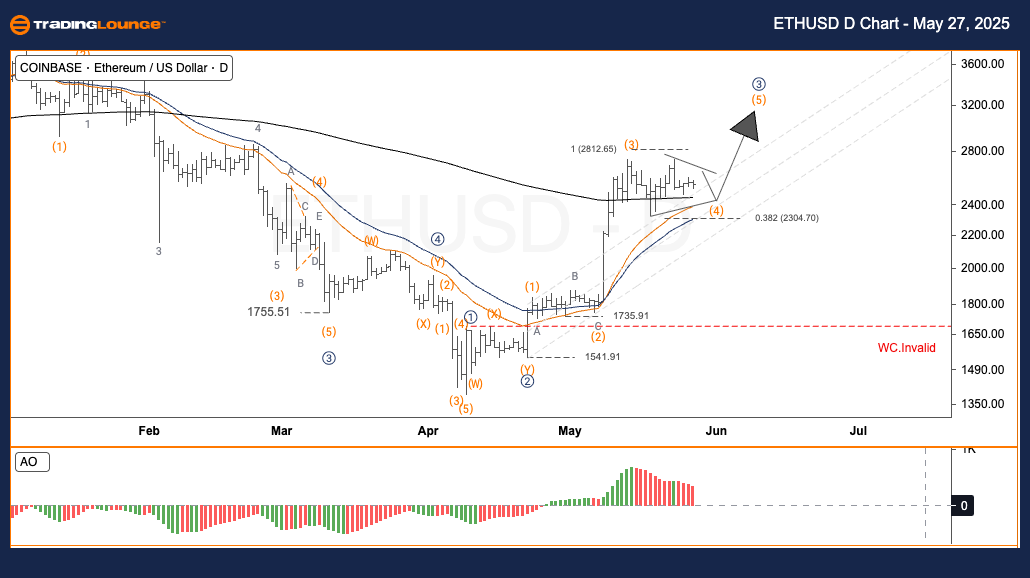
ETHUSD Elliott Wave Technical Overview
Function: Trend Following
Mode: Motive
Structure: Impulsive
Wave Position: Wave 3
Direction (Next Higher Degree): Pending Confirmation
Wave Invalid Level: Not specified
Ethereum (ETHUSD) – Daily Trading Strategy
Ethereum continues to maintain its bullish trajectory, completing a significant push in wave (3). The market then entered a consolidation zone, possibly forming a running triangle or flat correction, signaling the setup for wave (5). The previous peak near $2,736.32 confirmed an extended third wave, while price activity now points toward the formation of wave (4), preparing for the next bullish leg.
ETHUSD Trading Strategies
- Main Strategy: For short-term swing traders, closely observe the price range of $2,350–$2,400 for possible reversal signs.
- Risk Control: Place stop-loss orders below $2,320 to safeguard against a potential structural breakdown.
Ethereum Elliott Wave Analysis – TradingLounge H4 Chart
Ethereum / U.S. Dollar (ETHUSD) 4-Hour Chart Analysis
ETHUSD Elliott Wave Technical Overview
Function: Trend Following
Mode: Motive
Structure: Impulsive
Wave Position: Wave 3
Direction (Next Higher Degree): Pending Confirmation
Wave Invalid Level: Not specified
Ethereum (ETHUSD) – H4 Trading Strategy
Ethereum’s impulsive rise in wave (3) has transitioned into a sideways pattern, indicating either a running triangle or flat correction. This setup supports the view of an imminent wave (5) development. The completion of wave (3) at $2,736.32 reinforces the impulsive structure, while current price action hints that wave (4) is forming and might conclude shortly, enabling the market to resume its upward momentum.
Ethereum Trading Strategies
- Main Strategy: Short-term traders should monitor the $2,350–$2,400 zone for entry signals aligned with the anticipated trend continuation.
- Risk Control: Position stop-loss levels under $2,320 to mitigate risk from a potential structural reversal.'
Technical Analyst: Malik Awais
Source: Visit Tradinglounge.com and learn from the Experts. Join TradingLounge Here
Previous: THETAUSD Elliott Wave Technical Analysis
VALUE Offer - Buy 1 Month & Get 3 Months!Click here
Access 7 Analysts Over 200 Markets Covered. Chat Room With Support
