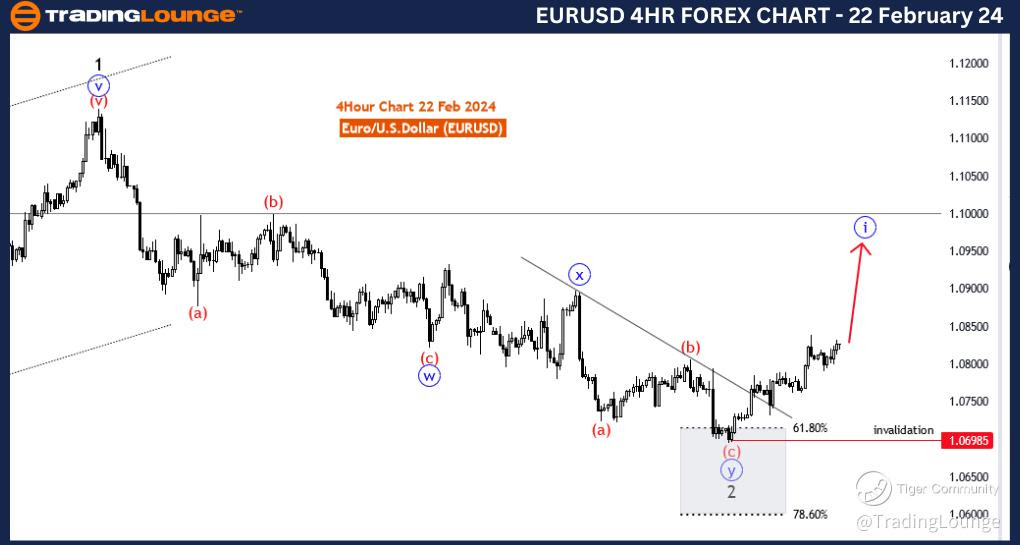
EURUSD Elliott Wave Analysis Trading Lounge 4 Hour Chart, 22 February 24
Euro/U.S.Dollar(EURUSD) 4 Hour Chart
EURUSD Elliott Wave Technical Analysis
FUNCTION: Trend
MODE: Impulsive
STRUCTURE: blue wave 1
POSITION: Black Wave 3
DIRECTION NEXT LOWER DEGREES: blue wave 2
DETAILS: blue wave Y of 2 looking completed at 1.06985 . Now blue wave 1 of 3 is in play. Wave Cancel invalid level: 1.06985
The "EURUSD Elliott Wave Analysis Trading Lounge 4 Hour Chart" dated 22 February 24, provides insights into the potential price movements of the Euro/U.S. Dollar (EURUSD) currency pair based on Elliott Wave analysis. The analysis focuses on identifying trends and wave patterns to guide traders in making informed decisions.
The identified "FUNCTION" in this analysis is "Trend," indicating that the primary objective is to understand and capitalize on the prevailing direction of the market. Recognizing the trend is crucial for traders to align their positions with the dominant market movement.
The specified "MODE" is "Impulsive," suggesting that the market is currently characterized by strong and directional price movements. Impulsive waves typically represent the main trend and can offer lucrative trading opportunities.
The described "STRUCTURE" is "Blue wave 1," which denotes the current phase within the Elliott Wave sequence. Wave 1 is usually the initial phase of a new trend and is closely monitored by traders for potential opportunities.
The designated "POSITION" is "Black Wave 3," indicating the current position within the broader Elliott Wave pattern. Wave 3 is often the strongest and most extended wave in the sequence, representing a powerful trend in the direction established by the first two waves.
Concerning "DIRECTION NEXT LOWER DEGREES," the analysis points to "Blue Wave 2," suggesting that a corrective wave is expected to follow the completion of the impulsive Blue Wave 1.
In the "DETAILS" section, it is mentioned that "Blue wave Y of 2 looking completed at 1.06985. Now blue wave 1 of 3 is in play." This implies that a corrective phase (wave Y of 2) has likely concluded, and the market is now in the early stages of the powerful impulsive wave 1 of 3.
The "Wave Cancel invalid level" is specified as 1.06985. This level is crucial for traders as it represents the point at which the current wave count would be invalidated.
In summary, the EURUSD Elliott Wave Analysis for the 4-hour chart on 22 February 24, suggests a strong impulsive trend with the market in the early stages of Blue Wave 1 of 3. Traders are advised to monitor the progression of this wave and be aware of the invalidation level at 1.06985.
Technical Analyst: Malik Awais
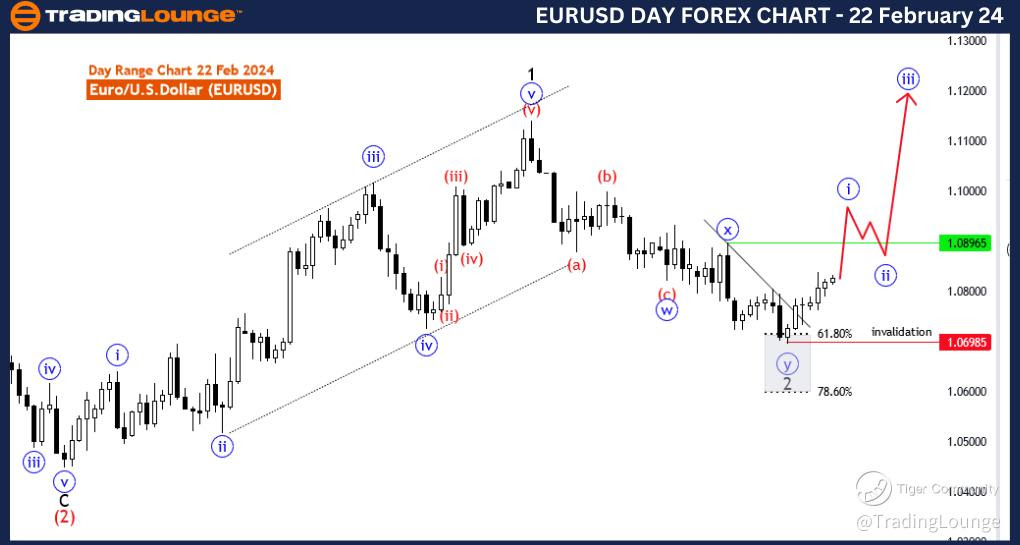
EURUSD Elliott Wave Analysis Trading Lounge Day Chart, 22 February 24
Euro/U.S.Dollar(EURUSD) Day Chart Analysis
Euro/U.S.Dollar Elliott Wave Technical Analysis
FUNCTION: Trend
MODE: Impulsive
STRUCTURE: blue wave 1
POSITION: Black Wave 3
DIRECTION NEXT LOWER DEGREES: blue wave 2
DETAILS: blue wave Y of 2 looking completed at 1.06985 . Now blue wave 1 of 3 is in play . WaveCancel invalid level: 1.06985
The "EURUSD Elliott Wave Analysis Trading Lounge Day Chart" for 22 February 24, provides a comprehensive analysis of the Euro/U.S. Dollar (EURUSD) currency pair, employing Elliott Wave principles to offer insights into potential market movements. This analysis is conducted on a daily chart, providing a broader perspective on the market.
The primary identified "FUNCTION" is "Trend," indicating the focus on understanding and capitalizing on the overarching direction of the market. Recognizing the trend is vital for traders to align their strategies with the prevailing market sentiment.
The specified "MODE" is "Impulsive," suggesting that the market is currently characterized by strong, directional price movements. Impulsive waves typically represent the core trend and offer substantial trading opportunities.
The described "STRUCTURE" is "Blue wave 1," signifying the current phase within the Elliott Wave sequence. Wave 1 is often the initial stage of a new trend and is closely monitored by traders for potential opportunities to enter or exit positions.
The designated "POSITION" is "Black Wave 3," indicating the current placement within the broader Elliott Wave pattern. Wave 3 is typically the most forceful and extended in the sequence, signifying a robust trend in the direction established by the first two waves.
In terms of "DIRECTION NEXT LOWER DEGREES," the analysis highlights "Blue Wave 2," suggesting an anticipated corrective wave following the completion of the impulsive Blue Wave 1.
The "DETAILS" section echoes the sentiment from the 4-hour chart, stating, "Blue wave Y of 2 looking completed at 1.06985. Now blue wave 1 of 3 is in play." This indicates the conclusion of a corrective phase (wave Y of 2) and the commencement of the formidable impulsive wave 1 of 3.
The "Wave Cancel invalid level" is set at 1.06985. This level is critical for traders as it represents the point at which the current wave count would be invalidated.
In summary, the EURUSD Elliott Wave Analysis for the day chart on 22 February 24, indicates a strong impulsive trend with the market commencing Blue wave 1 of 3. Traders are advised to monitor the development of this wave and be mindful of the invalidation level at 1.06985.
Technical Analyst: Malik Awais
Source: visit Tradinglounge.com and learn From the Experts Join TradingLounge Here
See Previous: British Pound/U.S.Dollar (GBPUSD)