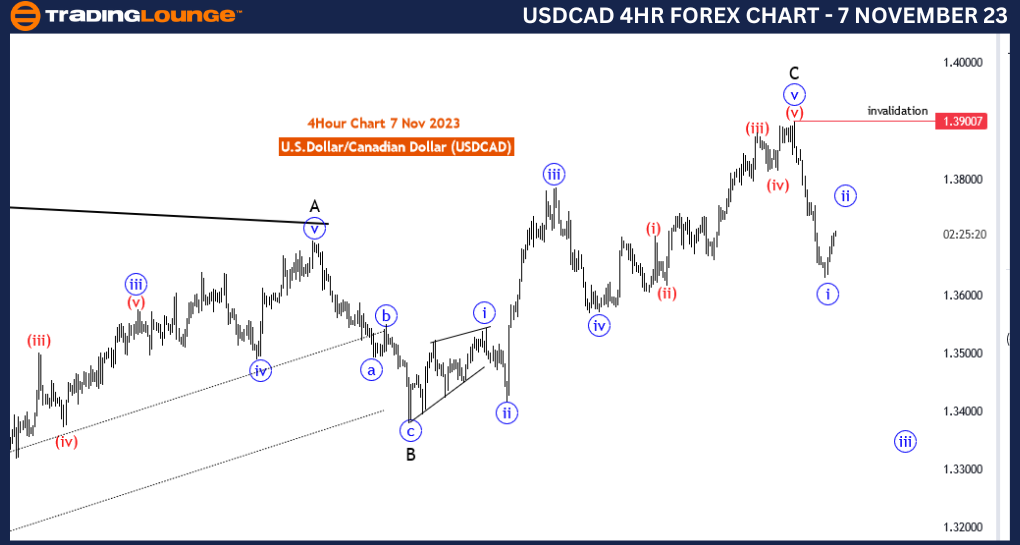
USD/CAD Elliott Wave Analysis Trading Lounge 4 Hour Chart, 7 November 23
U.S.Dollar /Canadian Dollar(USD/CAD) 4 Hour Chart
USD/CAD Elliott Wave Technical Analysis
Function: Trend
Mode: impulsive
Structure: blue wave 2 of new trend
Position: black wave 1
Direction Next Lower Degrees:blue wave 3
Details: Blue wave 1 looking completed at 1.36295 . Now blue wave 2 as a correction is in play . Wave Cancel invalid level:1.39007
The "USD/CAD Elliott Wave Analysis Trading Lounge 4 Hour Chart" dated 7 November 23, delves into a detailed analysis of the U.S. Dollar/Canadian Dollar (USD/CAD) currency pair. This analysis provides critical insights into the market's behavior, particularly in the context of Elliott Wave theory.
The primary function attributed to the market in this analysis is "Trend," signifying that the USD/CAD currency pair is currently experiencing a directional market movement. A market in a trending state typically sees prices moving consistently in a specific direction, allowing traders and investors to align their strategies with the prevailing sentiment.
The "Mode" of the analysis is categorized as "impulsive." In Elliott Wave theory, an impulsive wave typically indicates a strong and sustained market movement in the direction of the dominant trend. In this case, the mode is described as "blue wave 2 of a new trend," underlining a correction phase within the broader wave structure.
The analysis singles out "blue wave 1," marking its completion at a price level of 1.36295. This suggests that wave 1, which is part of the broader trend, has concluded, and the market has now shifted into "blue wave 2," denoting a correction phase. Corrections can be seen as brief pullbacks or counter-trend movements within an overall uptrend.
The "Direction" specified in the analysis is "Next Lower Degrees: blue wave 3." This indicates the anticipation of an upcoming blue wave 3, suggesting a resumption of the broader uptrend after the correction phase.
One crucial aspect for traders to note is the "Wave Cancel invalid level," identified at 1.39007. This level serves as a critical threshold for risk management. If the market approaches or surpasses this level, it could necessitate a reevaluation of the current wave count and trading strategies.
In summary, the USD/CAD Elliott Wave Analysis on the 4-hour chart dated 7 November 23, indicates a market in a trending state. After the completion of blue wave 1, a correction in the form of blue wave 2 is now in progress. The analysis anticipates further upward momentum in the form of blue wave 3, with the wave cancel invalid level serving as a crucial reference point for traders' risk management. This analysis provides valuable guidance for traders and investors looking to make informed decisions in the USD/CAD market.
Technical Analyst: Malik Awais
Source: Tradinglounge.com get trial here!
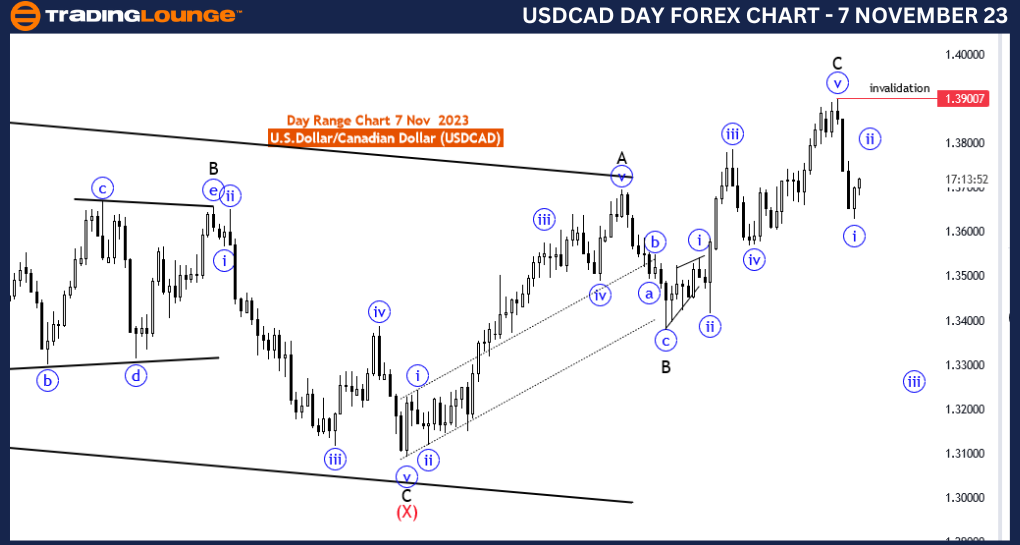
USD/CAD Elliott Wave Analysis Trading Lounge Day Chart, 7 November 23
U.S.Dollar /Canadian Dollar(USD/CAD) Day Chart
USD/CAD Elliott Wave Technical Analysis
Function: Trend
Mode: impulsive
Structure: blue wave 2 of new trend
Position: black wave 1
Direction Next Lower Degrees:blue wave 3
Details: Blue wave 1 looking completed at 1.36295 . Now blue wave 2 as a correction is in play . Wave Cancel invalid level:1.39007
The "USD/CAD Elliott Wave Analysis Trading Lounge Day Chart" for 7 November 23, provides a comprehensive assessment of the U.S. Dollar/Canadian Dollar (USD/CAD) currency pair using Elliott Wave analysis. This analysis is crucial for traders and investors seeking to understand the potential future movements in this currency pair.
The primary function ascribed to the USD/CAD market in this analysis is "Trend." This suggests that the market is currently experiencing a directional movement, and traders may find opportunities aligned with the prevailing trend. Furthermore, the "Mode" is defined as "impulsive," indicating a strong and sustained market movement.
The core structural component under investigation is "blue wave 2 of a new trend." This reflects a correction phase within the broader market trend, suggesting that a temporary counter-trend movement is underway. In Elliott Wave theory, such corrections provide traders with valuable insights into potential entry and exit points.
Positioning within the market structure, the "black wave 1" is acknowledged as having completed at a price level of 1.36295. This is a significant observation, indicating the conclusion of the initial wave within the new trend. As a result, the market has transitioned into "blue wave 2," representing a correction or pullback.
The anticipated "Direction" identified in the analysis is "Next Lower Degrees: blue wave 3." This implies that once the correction phase in blue wave 2 is complete, the market is expected to resume its broader upward movement with the onset of blue wave 3.
Traders and investors are provided with an essential reference point for risk management - the "Wave Cancel invalid level" marked at 1.39007. This level is a critical threshold, and movements beyond it could trigger a reevaluation of the current wave count and trading strategies.
To summarize, the USD/CAD Elliott Wave Analysis on the daily chart for 7 November 23, indicates a trending market with an impulsive mode. The analysis highlights the completion of black wave 1 and the initiation of a correction phase denoted by blue wave 2. This correction is expected to be followed by a resumption of the uptrend with blue wave 3. The wave cancel invalid level serves as a crucial reference point for risk management. This analysis provides valuable insights for traders and investors looking to navigate the USD/CAD market effectively.
Technical Analyst: Malik Awais
Source: Tradinglounge.com get trial here!