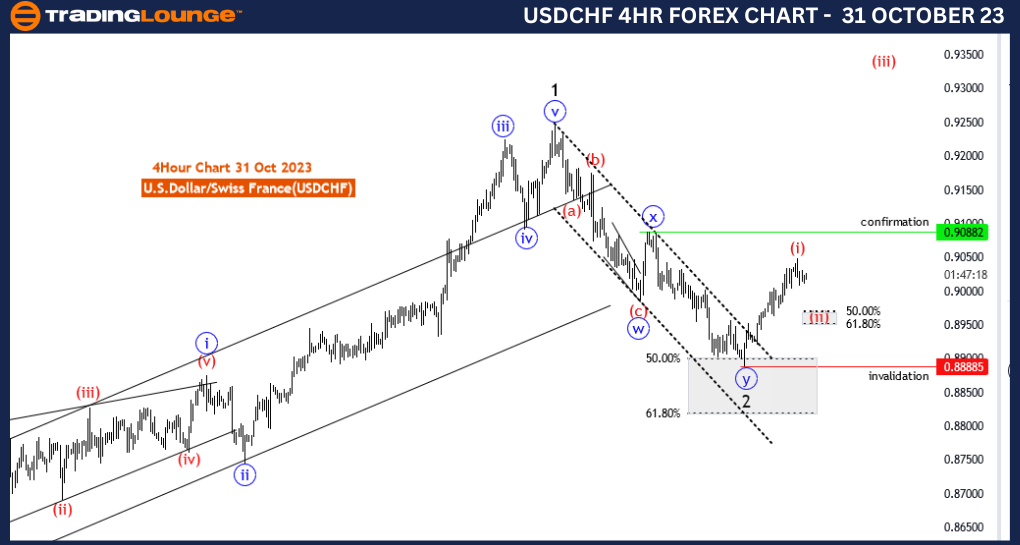
USDCHF Elliott Wave Analysis Trading Lounge 4 Hour Chart, 31 October 23
U.S.Dollar/Swiss Franc(USDCHF) 4 Hour Chart
USDCHF Elliott Wave Technical Analysis
Function: Trend
Mode: impulsive
Structure: red wave 2 of blue wave 1
Position: Black wave 3
Direction Next Higher Degrees: red wave 3
Details: red wave 1 looking completed at 0.90491,now red wave 2 is in play , after that wave 3 of 1 will start. Wave Cancel invalid level: 0.88885
The "USDCHF Elliott Wave Analysis Trading Lounge 4 Hour Chart" dated 31 October 23, presents insightful information for traders interested in the U.S. Dollar/Swiss Franc (USD/CHF) currency pair. This analysis pertains to the 4-hour chart, which is essential for traders aiming to make informed decisions within this specific time frame.
The analysis identifies the market's function as "Trend," indicating that the current price action aligns with the prevailing market trend. Recognizing the dominant trend direction is crucial for traders as it helps inform trading strategies and positions.
The mode is categorized as "impulsive," signifying strong and decisive price movements. Impulsive moves are typically associated with powerful momentum and directionality in the market. Traders often seek trading opportunities that are consistent with impulsive price movements in line with the established trend.
The structure is described as "red wave 2 of blue wave 1," which is a specific wave count within Elliott Wave theory. The mention of "blue wave 1" suggests that the analysis is focused on a higher-degree wave count, with "red wave 2" indicating the current phase within this count. For Elliott Wave practitioners, understanding the wave count is fundamental as it helps in projecting future price movements based on wave patterns.
The analysis points out that "red wave 1" is perceived to be completed at the level of 0.90491. This suggests a phase of upward movement in the market. Following this, "red wave 2" is currently in play, indicating a corrective wave within the broader bullish trend. Traders often look for entry points during corrective waves to benefit from favorable price levels.
Importantly, the "Wave Cancel invalid level: 0.88885" is specified, acting as a reference point for traders. This level is crucial for risk management and trade validation. If the market reaches or surpasses this level, it implies that the existing wave structure may be invalidated, prompting traders to reconsider their trading strategies.
In summary, the USD/CHF Elliott Wave Analysis for the 4-hour chart on 31 October 23, offers valuable insights to traders. The market's trend direction and impulsive mode indicate favorable conditions for trading. The provided wave count highlights the completion of "red wave 1" and the ongoing "red wave 2," which can be an opportunity for traders. The wave invalidation level serves as a guide for managing risk and trade validity, helping traders adapt to changing market conditions. This information is essential for traders operating within the 4-hour time frame.
Technical Analyst: Malik Awais
Source: Tradinglounge.com get trial here!

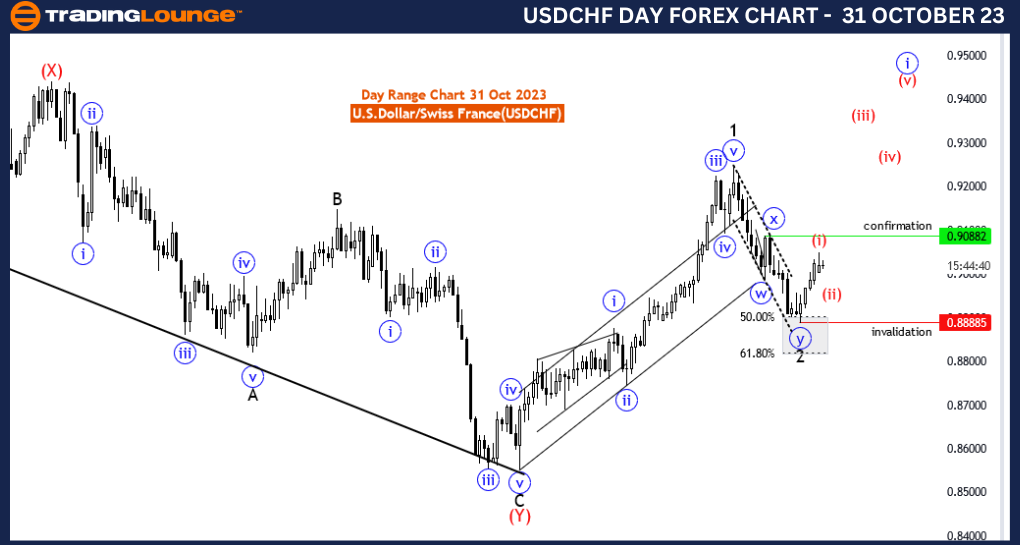
USDCHF Elliott Wave Analysis Trading Lounge Day Chart, 31 October 23
U.S.Dollar/Swiss Franc(USDCHF) Day Chart
USDCHF Elliott Wave Technical Analysis
Function: Trend
Mode: impulsive
Structure: blue wave 1 of black wave 3
Position: Black wave 3
Direction Next Higher Degrees: blue wave 1 (continue)
Details: black wave 2 completed at 0.88885 .Now blue wave 1 of black wave 3 is in play. Wave Cancel invalid level: 0.88885
The "USDCHF Elliott Wave Analysis Trading Lounge Day Chart" dated 31 October 23, provides valuable insights for traders interested in the U.S. Dollar/Swiss Franc (USD/CHF) currency pair. This analysis is focused on the daily chart, a critical timeframe for traders looking to make strategic decisions over more extended periods.
The market's function is identified as "Trend," indicating that the current price action is aligned with the prevailing market trend. Recognizing the dominant trend direction is essential for traders to develop well-informed trading strategies and positions.
The mode is categorized as "impulsive," signifying strong and decisive price movements. Impulsive price movements often indicate a powerful market trend, providing traders with the potential for significant opportunities to capitalize on momentum.
The analysis focuses on the structure of "blue wave 1 of black wave 3." This is a specific wave count within Elliott Wave theory, where "black wave 3" represents the larger degree wave count, and "blue wave 1" is the current phase within this count. Elliott Wave analysis aims to identify wave patterns and anticipate future price movements based on these patterns.
The analysis indicates that "black wave 2" is completed at 0.88885, signifying the end of a corrective wave. Following this, "blue wave 1 of black wave 3" is in play, suggesting a new bullish trend within the larger trend structure.
A key point to note is the "Wave Cancel invalid level: 0.88885." This level is important for risk management and trade validation. If the market approaches or surpasses this level, it may indicate a potential invalidation of the current wave structure, prompting traders to reconsider their trading strategies.
In summary, the USD/CHF Elliott Wave Analysis for the daily chart on 31 October 23, offers valuable insights to traders operating on longer timeframes. The identified trend and impulsive mode present favorable conditions for trading. The detailed wave count provides a structured approach to understanding the market's current phase. The presence of a wave invalidation level offers guidance for risk management and trade validation, which is crucial for traders seeking to adapt to changing market conditions. This information is essential for traders looking to make informed decisions over more extended time horizons.
Technical Analyst: Malik Awais
Source: Tradinglounge.com get trial here!
