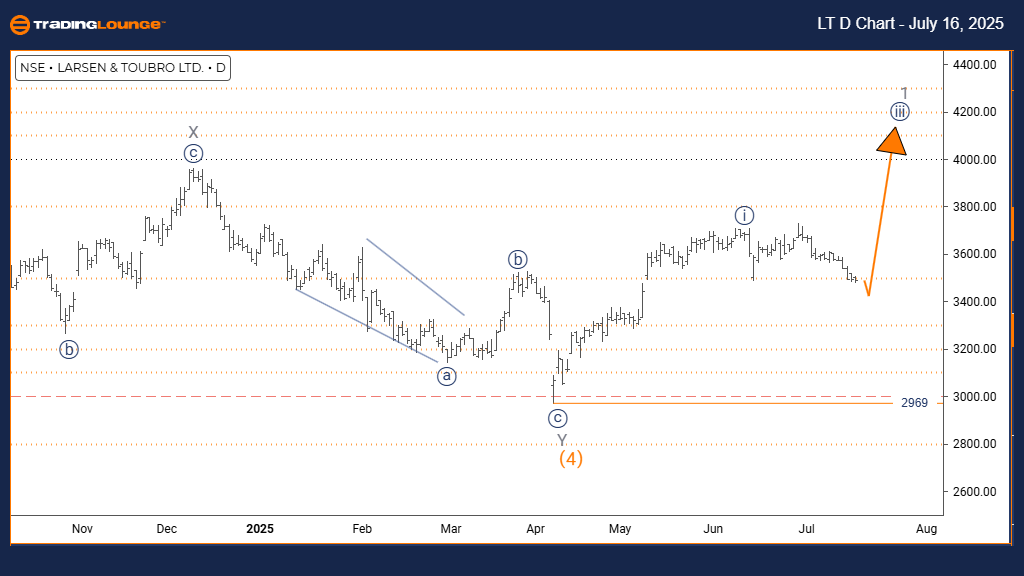
LARSEN & TOUBRO Elliott Wave Analysis – Trading Lounge Day Chart
LARSEN & TOUBRO Elliott Wave Technical Analysis
FUNCTION: Bullish Trend
MODE: Impulsive
STRUCTURE: Navy Blue Wave 1
POSITION: Gray Wave 1
DIRECTION NEXT LOWER DEGREES: Navy Blue Wave 2
DETAILS: Orange Wave 4 is likely complete. Navy Blue Wave 1 of Gray Wave 1 is now developing.
Wave Cancel Invalid Level: 2969
The daily Elliott Wave analysis for LARSEN & TOUBRO stock indicates a strong bullish trend backed by an impulsive wave structure. Currently, price action suggests that the market is in Navy Blue Wave 1, which lies within a larger Gray Wave 1 formation—signaling the early stage of a potential long-term uptrend. The completion of Orange Wave 4 adds weight to the current wave progression.
This impulsive move supports continued upward price momentum, illustrated by a consistent series of higher highs and higher lows. The next expected wave is Navy Blue Wave 2, typically representing a corrective phase. Maintaining the wave count requires the price to stay above 2969, the invalidation threshold. A break below this would nullify the current bullish structure and necessitate a revised analysis.
This technical setup implies that LARSEN & TOUBRO has likely exited its correction phase and entered a fresh impulsive trend, offering new buying opportunities. As the wave count unfolds, traders should monitor Navy Blue Wave 1 for signs of completion and prepare for potential retracement under Wave 2.
The 2969 level remains pivotal for maintaining the bullish outlook. Holding above this point keeps the current wave formation intact and validates the Elliott Wave forecast. This analysis supports risk management and entry planning in alignment with the overall uptrend.
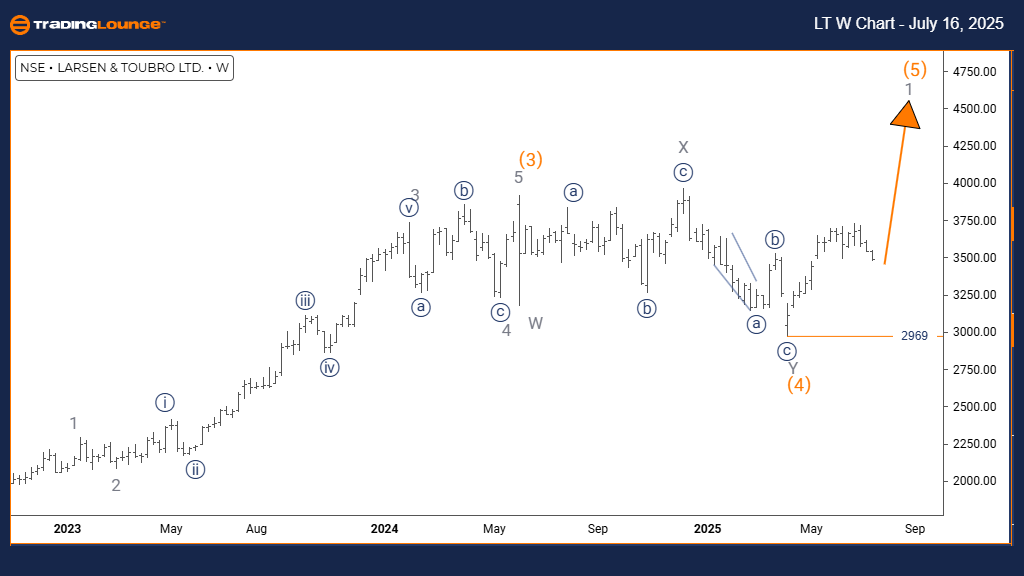
LARSEN & TOUBRO Elliott Wave Analysis – Trading Lounge Weekly Chart
LARSEN & TOUBRO Elliott Wave Technical Analysis
FUNCTION: Bullish Trend
MODE: Impulsive
STRUCTURE: Gray Wave 1
POSITION: Orange Wave 5
DIRECTION NEXT LOWER DEGREES: Gray Wave 2
DETAILS: Orange Wave 4 appears completed. Gray Wave 1 is now in progress.
Wave Cancel Invalid Level: 2969
The weekly Elliott Wave analysis of LARSEN & TOUBRO confirms a bullish market trend, supported by a clear impulsive structure. The price action reflects the formation of Gray Wave 1 inside a broader Orange Wave 5, indicating that the stock is likely entering the final phase of an intermediate uptrend. The conclusion of Orange Wave 4 suggests that Gray Wave 1 is now driving prices higher.
The impulsive momentum points to strong institutional interest and bullish sentiment. Since the current wave forms within Orange Wave 5, it may signify the last stretch of the medium-term trend, while Gray Wave 1 hints at the initiation of a new long-term move. The critical support level remains at 2969, which must hold to sustain the bullish view.
This Elliott Wave configuration indicates that L&T stock has moved beyond its correction and is entering a fresh bullish cycle, offering potential for further price gains. The upcoming move is Gray Wave 2, typically a minor correction within a larger impulse wave. This phase will be essential to validate the continuation of the trend.
The 2969 support level plays a key role in risk control and wave count validity. Remaining above it confirms the bullish bias, helping traders align with the larger trend. Monitoring Gray Wave 1 for completion signs is crucial before any expected pullback. Overall, the weekly chart outlines a strong, continuing uptrend with clear implications for long-term trading strategies.
Technical Analyst: Malik Awais
Source: Visit Tradinglounge.com and learn from the Experts. Join TradingLounge Here
Previous: COAL INDIA Elliott Wave Technical Analysis
VALUE Offer - Buy 1 Month & Get 3 Months!Click here
Access 7 Analysts Over 200 Markets Covered. Chat Room With Support