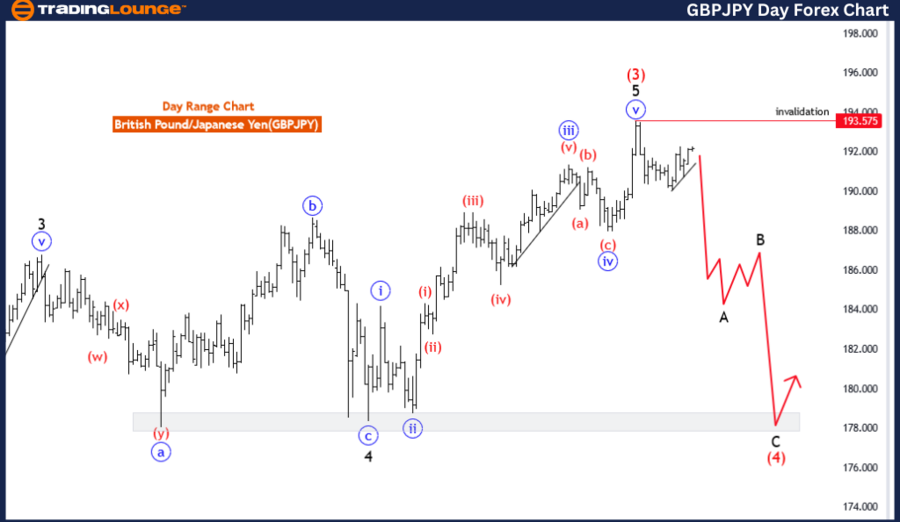
GBPJPY Elliott Wave Analysis Trading Lounge Day Chart,
British Pound/Japanese Yen(GBPJPY) Day Chart Analysis
GBPJPY Elliott Wave Technical Analysis
FUNCTION: Counter Trend
MODE: Corrective
STRUCTURE: black wave A
POSITION: Red wave 4
DIRECTION NEXT HIGHER DEGREES: black wave B
DETAILS: Red Wave 3 completed at 193.575. Now black wave A of Red wave 4 is in play. Wave Cancel invalid level: 193.575
The GBP/JPY Elliott Wave Analysis for the daily chart provides traders with valuable insights into the potential price movements of the British Pound against the Japanese Yen, employing Elliott Wave principles for technical analysis.
Identified as a "Counter Trend" scenario, the analysis indicates that the prevailing market direction is opposed to the primary trend, suggesting a potential reversal or corrective phase in the GBP/JPY pair. Traders may interpret this as a temporary deviation from the overall downtrend in the currency pair.
Described as "Corrective" in mode, the analysis suggests that the current market movement represents a corrective phase within the broader Elliott Wave cycle. This implies that the recent price action is part of a corrective pattern rather than a new impulsive trend.
The "STRUCTURE" is identified as "Black wave A," providing clarity on the current wave count within the Elliott Wave cycle. This assists traders in understanding the ongoing corrective pattern and its alignment with the broader Elliott Wave structure.
Positioned as "Red wave 4," the analysis highlights the current wave count within the larger Elliott Wave cycle, indicating the specific phase of the potential corrective pattern. This suggests that the market is currently experiencing a corrective phase within the broader wave structure.
The "DIRECTION NEXT HIGHER DEGREES" is denoted as "Black wave B," implying the anticipated direction for the subsequent higher-degree wave within the corrective pattern. This indicates that following the completion of the current corrective phase, a new impulsive movement may ensue before a potential continuation of the downtrend.
In the "DETAILS" section, it is mentioned that "red wave 3 completed at 193.575. Now black wave A of Red wave 4 is in play." This suggests that the previous impulsive wave has been completed, and the market is now in the initial phase of a corrective pattern. The "Wave Cancel invalid level" at 193.575 serves as a reference point for traders to monitor potential invalidation of the current wave count.
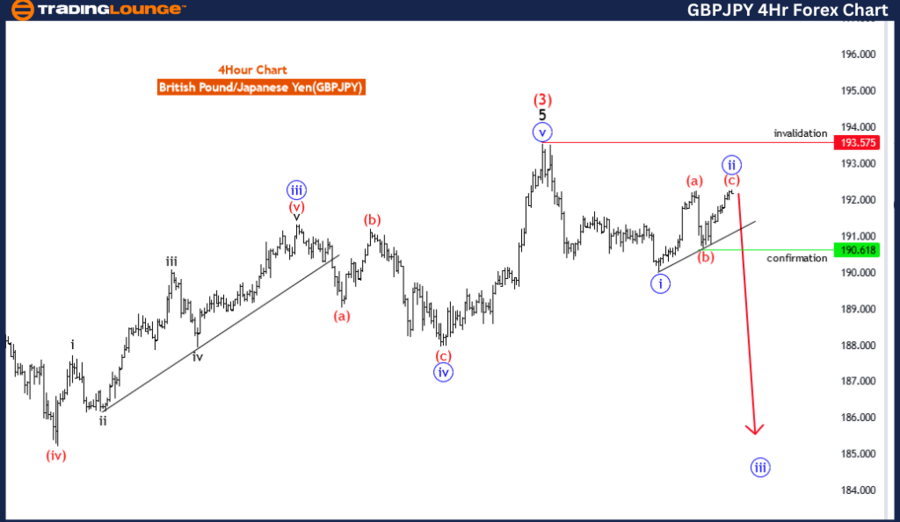
GBPJPY Elliott Wave Analysis Trading Lounge 4-Hour Chart,
British Pound/Japanese Yen(GBPJPY) 4 Hour Chart Analysis
Elliott Wave Analysis of GBPJPY
FUNCTION: Counter Trend
MODE: impulsive
STRUCTURE: blue wave 3
POSITION: black wave A
DIRECTION NEXT HIGHER DEGREES: blue wave 4 of A
DETAILS: blue wave 2 of A may be completed or near to end, now looking for blue wave 3. Wave Cancel invalid level: 193.575
The GBP/JPY Elliott Wave Analysis for the 4-hour chart presents traders with insights into the potential price movements of the British Pound against the Japanese Yen, utilizing Elliott Wave principles for technical analysis.
Identified as a "Counter Trend" scenario, the analysis suggests that the prevailing market direction runs contrary to the primary trend, indicating a potential reversal or corrective phase in the GBP/JPY pair. This implies that traders may anticipate a temporary deviation from the overall downtrend in the currency pair.
Characterized as "Impulsive" in mode, the analysis indicates that the current market movement displays characteristics of impulsiveness, suggesting a strong and sustained buying or selling momentum. In this case, it suggests a strong upward movement in the GBP/JPY pair, likely signalling a reversal from the downtrend.
The "STRUCTURE" is identified as "Blue wave 3," providing clarity on the current wave count within the Elliott Wave cycle. This assists traders in understanding the ongoing bullish momentum and its alignment with the broader Elliott Wave structure.
Positioned as "Black wave A," the analysis highlights the current wave count within the larger Elliott Wave cycle, indicating the specific phase of the potential corrective pattern. This suggests that the market is currently experiencing a corrective phase within the broader wave structure.
The "DIRECTION NEXT HIGHER DEGREES" is denoted as "Blue wave 4 of A," implying the anticipated direction for the subsequent higher-degree wave within the corrective pattern. This indicates that following the completion of the current bullish wave, a corrective phase may ensue before a potential continuation of the downtrend.
In the "DETAILS" section, it is mentioned that "blue wave 2 of A may be completed or near to end, now looking for blue wave 3." This signifies that the corrective phase of the Elliott Wave cycle may be concluding, and the market could be poised for a new impulsive movement in the direction of the counter-trend. The "Wave Cancel invalid level" at 193.575 serves as a reference point for traders to monitor potential invalidation of the current wave count.
Technical Analyst: Malik Awais
Source: visit Tradinglounge.com and learn From the Experts Join TradingLounge Here
See Previous: U.S.Dollar /Canadian Dollar(USD/CAD)
TradingLounge Once Off SPECIAL DEAL: Here > 1 month Get 3 months.
TradingLounge's Free Week Extravaganza!
April 14 – 21: Unlock the Doors to Trading Excellence — Absolutely FREE