15Jul

Elliott Wave Analysis of COAL INDIA: Reveals Impulsive Gray Wave C Inside Orange Wave 2 Corrective Phase Signaling Strong Bearish Momentum and Trend Reversal Setup

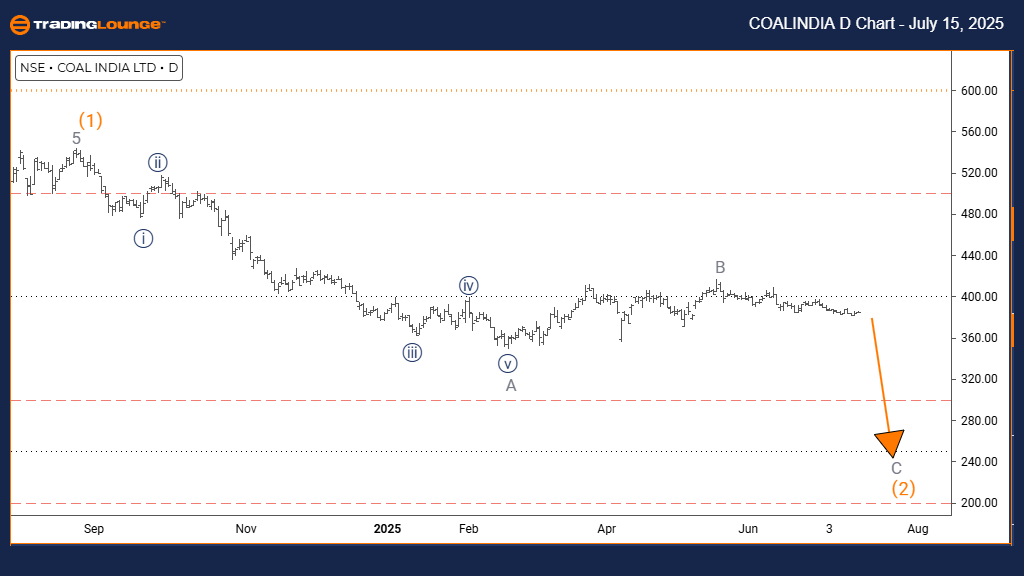
COAL INDIA Elliott Wave Analysis – Trading Lounge Day Chart

COAL INDIA Elliott Wave Technical Analysis

Function: Counter Trend

Mode: Impulsive

Structure: Gray Wave C

Position: Orange Wave 2

Direction Next Lower Degrees: Gray Wave C (In Progress)

Details: Completion of Gray Wave B confirmed; Gray Wave C now developing.

Daily Elliott Wave analysis for COAL INDIA highlights a counter-trend scenario. Current price movement confirms an impulsive Gray Wave C, forming inside the corrective phase identified as Orange Wave 2.

The pattern suggests that Gray Wave B has ended. With Gray Wave C in motion, COAL INDIA enters the concluding leg of its corrective sequence. This wave generally marks the end of a correction before the dominant trend resumes.

The impulsive nature of Gray Wave C indicates intensified bearish momentum. As the wave unfolds, further price drops are likely. This implies COAL INDIA remains within a corrective structure, with Gray Wave C aimed at completing the ongoing adjustment.

Positioned within Orange Wave 2, this decline likely forms part of a broader correction. Gray Wave C is the pivotal movement traders should monitor. As this wave evolves, signs of exhaustion could indicate the potential start of a new upward trend. The intensity in this impulsive wave suggests the downtrend has not yet concluded.

Understanding COAL INDIA’s current wave position offers critical insights for traders. Although the counter-trend phase may continue, being aware of Elliott Wave patterns can help identify trend reversals. Caution remains essential as corrections can shift unexpectedly, making robust risk management strategies crucial.

COAL-d-indian-chart-...


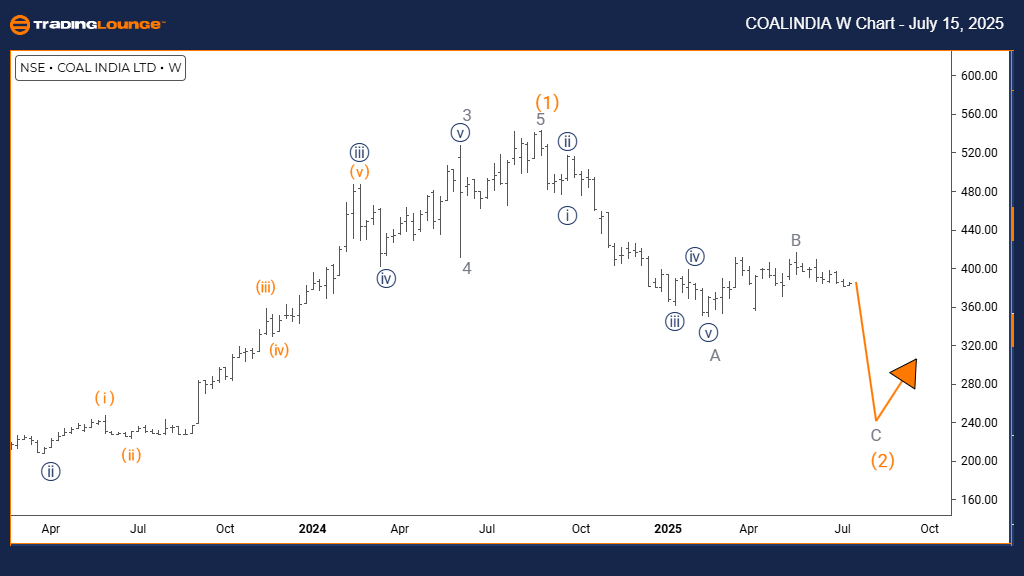
COAL INDIA Elliott Wave Analysis – Trading Lounge Weekly Chart

COAL INDIA Elliott Wave Technical Analysis

Function: Counter Trend

Mode: Impulsive

Structure: Gray Wave C

Position: Orange Wave 2

Direction Next Higher Degrees: Orange Wave 3

Details: Gray Wave B appears finished; Gray Wave C is now unfolding.

The weekly Elliott Wave view of COAL INDIA confirms a corrective move within a larger trend. The development of impulsive Gray Wave C under Orange Wave 2 signals a pullback in progress.

Evidence from wave structure indicates Gray Wave B has concluded. Current price behavior supports the active formation of Gray Wave C, typically seen as the final movement in a standard corrective cycle. The impulse-driven price action points to a continuing decline.

This structure, as part of Orange Wave 2, reflects an intermediate retracement. Once Gray Wave C completes, Orange Wave 3—a wave of higher degree—could initiate a new bullish phase. COAL INDIA appears to be in the latter stage of correction, preparing for trend resumption.

Close observation of Gray Wave C is key. When this wave loses momentum, the transition to Orange Wave 3 may occur. For now, price pressure is expected to continue as the impulsive decline progresses.

This Elliott Wave analysis on the weekly chart helps traders position COAL INDIA within a macro-cycle. The current counter-trend phase may be reaching completion. Traders can use Elliott Wave insight to spot reversal zones, although high uncertainty means applying disciplined risk control remains vital.

Technical Analyst: Malik Awais

Source: Visit Tradinglounge.com and learn from the Experts. Join TradingLounge Here

Previous: AXIS BANK Elliott Wave Technical Analysis

VALUE Offer - Buy 1 Month & Get 3 Months!Click here

Access 7 Analysts Over 200 Markets Covered. Chat Room With Support

COAL-w-indian-chart-...

Related

Microsoft Inc. (MSFT) Elliott Wave Analysis: Stock Forecast, Price Prediction & Market Trends for Bullish or Bearish Reversal

Microsoft Inc. (MSFT) Elliott Wave Analysis: Stock Forecast, Price Prediction & Market Trends for Bullish or Bearish Reversal

MSFT Elliott Wave analysis examines Microsoft stock's trend using Elliott Wave Theory to identif...

Read More >
Outlines the Future market movements with KOSPI Composite Index Elliott Wave Technical Analysis

Outlines the Future market movements with KOSPI Composite Index Elliott Wave Technical Analysis

This article provides an in-depth Elliott Wave analysis of the KOSPI Composite Index, covering both ...

Read More >
Elliott Wave XLE SPDR Energy Select Sector ETF Analysis Reveals Bullish Energy ETF Forecast and Key Trading Strategy for 2025 Investors

Elliott Wave XLE SPDR Energy Select Sector ETF Analysis Reveals Bullish Energy ETF Forecast and Key Trading Strategy for 2025 Investors

This technical overview of XLE applies Elliott Wave analysis to project upcoming movements in the SP...

Read More >
Swiss Market Index Elliott Wave Technical Analysis - SMI financial news and Stock market analysis

Swiss Market Index Elliott Wave Technical Analysis - SMI financial news and Stock market analysis

Explore the latest Elliott Wave Analysis for the Swiss Market Index (SMI) and gain valuable trading ...

Read More >
U.S. Dollar / Japanese Yen (USDJPY) Elliott Wave Analysis: Forex Market Trends & Technical Analysis for Better Trading Decisions

U.S. Dollar / Japanese Yen (USDJPY) Elliott Wave Analysis: Forex Market Trends & Technical Analysis for Better Trading Decisions

USDJPY Elliott Wave analysis examines the current Forex market trends using the Elliott Wave theory....

Read More >
Exxon Mobil Corp.(XOM:NYSE) Elliott Wave Technical Analysis

Exxon Mobil Corp.(XOM:NYSE) Elliott Wave Technical Analysis

Exxon Mobil Corp.(XOM:NYSE) Elliott Wave Technical Analysis  looking for longs after upside confirma...

Read More >

$1 for 2 Weeks

then $29 a month!

What a Special Offer!

Trade Recommendations

Unleash the power of deversified trading with our comprehensive portfolio, covering 250+ markets:

  • Stock Trades
  • Crypto Trades
  • Forex Trades
  • Commodity Trades
Elliott Wave Analysis

Gain a competitive edge with expert insights and AI-powered Elliott Wave charting into:

  • Global Indices
  • US Stocks & ASX Stocks
  • Forex & Crypto
  • Commodities
Top-Notch Trading Tools

Equip yourself with the tools of success:

  • Real-time Chat rooms
  • Elliott Wave Algorithm
  • Portfolio tools
  • TradingLevels
  • Screener
  • Trading Game
7 Elliott Wave Analysts

Stay ahead of the market with daily charts and insightful videos
Your secret to strategic trading!

JOIN HERE


Welcome to TradingLounge (ASIC A.R.No. 321187), specialists in trades, trading education and technical analysis, covering stocks, indices, commodities, forex and cryptocurrencies.

When you join TradingLounge you have access to everything we offer, including trade tools, educational content and a social platform to chat with like-minded investors.

Read more

@Copyright 2024 by tradinglounge.com

Contact Us

Australian no: 02 4787 6020

International no: +61 (2) 47876020

Pay with:

Find us on