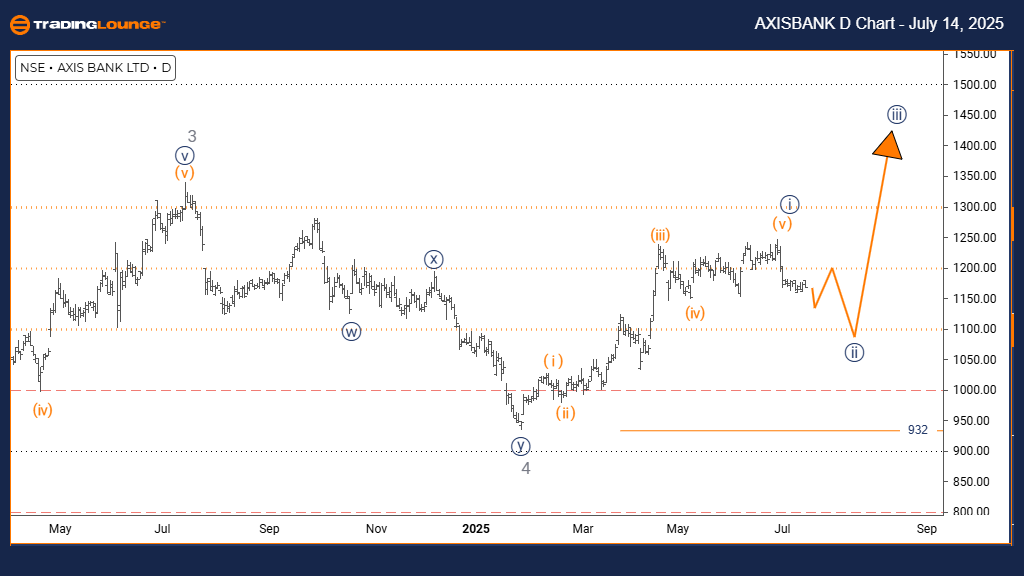
AXIS BANK Elliott Wave Analysis – Trading Lounge Day Chart
AXIS BANK Indian Stock Day Chart Analysis
AXIS BANK Elliott Wave Technical Analysis
Function: Counter Trend
Mode: Corrective
Structure: Navy Blue Wave 2
Position: Gray Wave 5
Next Higher Degree Direction: Navy Blue Wave 3
Details: Navy blue wave 1 completed; wave 2 of 5 currently developing
Invalidation Level: 932
Market Overview and Structural Breakdown
The daily Elliott Wave chart for AXIS BANK outlines a corrective phase within a broader bullish cycle. The stock is presently navigating navy blue wave 2, which is embedded in the longer-term gray wave 5 sequence. This current phase signals a short-term pullback within a generally upward trend.
Navy blue wave 1 has concluded, giving way to wave 2's development. As a counter-trend move, this suggests a temporary slowdown in upward momentum. The next anticipated shift is toward navy blue wave 3, aligning with a return to the primary bullish trajectory.
Key Technical Levels and Market Dynamics
The critical invalidation point is 932. A drop below this level would invalidate the present wave count, requiring structural reassessment.
Since wave 2 is corrective by nature, traders can expect low momentum, which may translate to sideways or mildly bearish price action. It's prudent to wait for the completion of wave 2 before projecting the start of navy blue wave 3, which is expected to carry more decisive market direction.
Trading Strategy and Market Implications
This analysis serves as a framework for interpreting market cycles via the Elliott Wave method. The current corrective structure in wave 2 emphasizes caution. Traders should use the 932 level as a reference point for managing downside risk.
Monitoring this setup allows for strategic positioning, ensuring alignment with broader wave patterns and disciplined risk control.
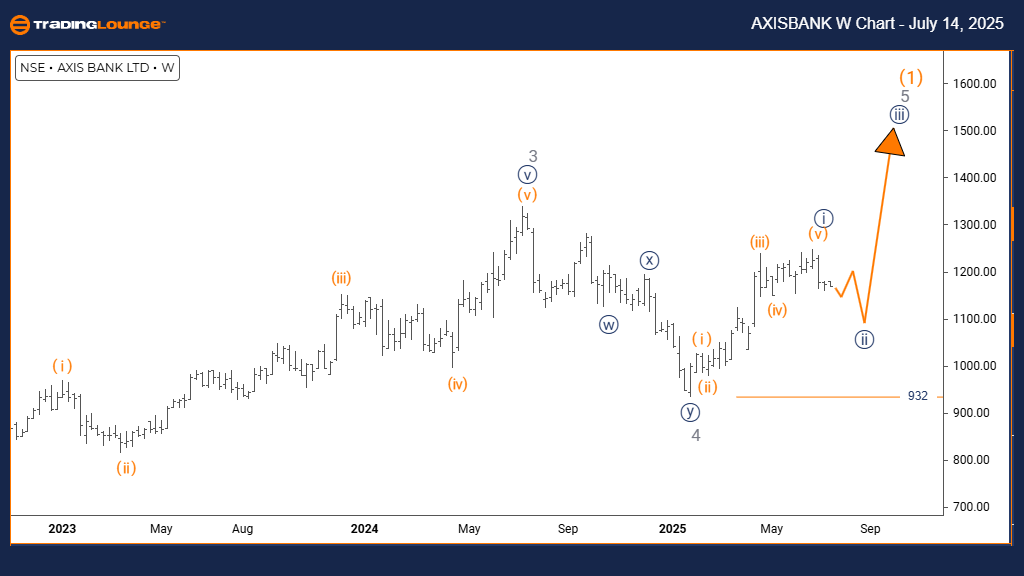
AXIS BANK Elliott Wave Analysis – Trading Lounge Weekly Chart
AXIS BANK Elliott Wave Technical Analysis
Function: Counter Trend
Mode: Corrective
Structure: Navy Blue Wave 2
Position: Gray Wave 5
Next Higher Degree Direction: Navy Blue Wave 3
Details: Wave 1 has likely concluded; wave 2 of 5 is currently forming
Invalidation Level: 932
Weekly Outlook and Structural Synopsis
The weekly Elliott Wave analysis of AXIS BANK suggests a counter-trend corrective phase, currently progressing within navy blue wave 2, part of the broader gray wave 5 structure. This development hints at a medium-term retracement within a sustained uptrend.
With navy blue wave 1 appearing complete, the market now unfolds into wave 2 of 5. This segment typically reflects a temporary pullback before a potential bullish continuation through navy blue wave 3.
Key Price Levels and Technical Focus
Wave 2's corrective identity implies a slowdown, often reflected in sideways or declining price action. This contrasts with the momentum-driven nature of impulse waves. The invalidation point remains firmly at 932—if breached, the entire wave structure would be invalidated.
This level becomes a vital reference for risk management and trading confidence, helping traders discern between wave continuation and potential structural shifts.
Strategic Considerations for Market Participants
This wave-based reading provides long-term market clarity, especially for those integrating multi-timeframe analysis. Understanding wave progression helps recognize potential trend reversal points and structure-aligned entry opportunities.
As wave 2 nears completion, traders should prepare for a possible transition to the more impulsive wave 3. Respect for the invalidation threshold at 932 remains crucial for safeguarding trading capital and maintaining tactical flexibility.
Technical Analyst: Malik Awais
Source: Visit Tradinglounge.com and learn from the Experts. Join TradingLounge Here
Previous: INFOSYS LABORATORIES Elliott Wave Technical Analysis
VALUE Offer - $1 for 2 Weeks then $29 a month!Click here
Access 7 Analysts Over 200 Markets Covered. Chat Room With Support