TXN Elliott Wave Analysis: Texas Instruments Inc. (TXN)

Discover the latest Elliott Wave analysis for Texas Instruments (TXN) as of May 17, 2024. Learn about key support and resistance levels, and potential price targets for TXN stock.

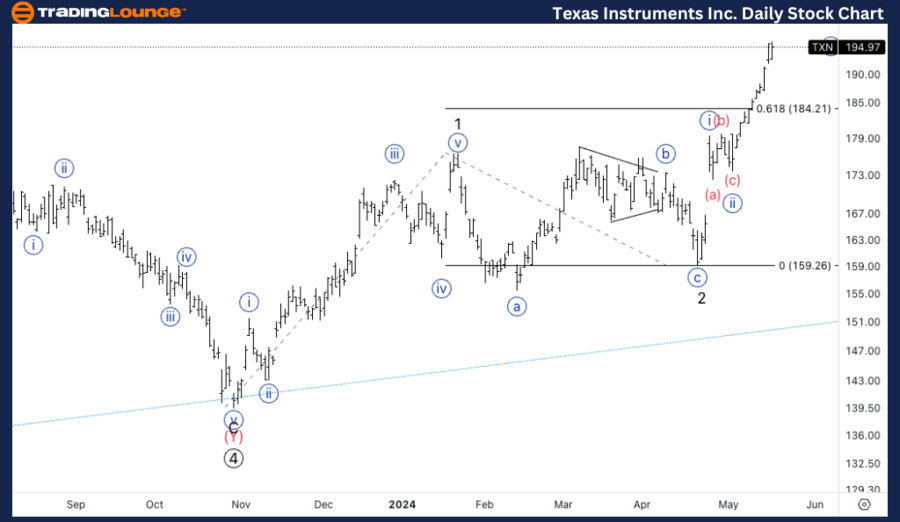
TXN Elliott Wave Technical Analysis - Daily Chart

FUNCTION: Trend

MODE: Impulsive

STRUCTURE: Motive

POSITION: Minute {iii} or 3.

DIRECTION: Upside in {iii}.

DETAILS: Texas Instruments Inc. (TXN) is progressing as anticipated in its Elliott Wave pattern. The current wave structure suggests an impulsive trend, specifically in the minute wave {iii}. We are observing the movement towards at least equality of wave 3 compared to wave 1. There is a potential for this pattern to evolve into an ABC correction, with equality between wave C and wave A being a common target.

Texas Instruments (TXN) is moving as expected within the impulsive wave structure. We are looking for at least equality of wave 3 vs. wave 1. This movement could potentially turn into an ABC pattern, as equality of wave C vs. wave A is a common target in corrective waves.

Texas-Instruments-In...


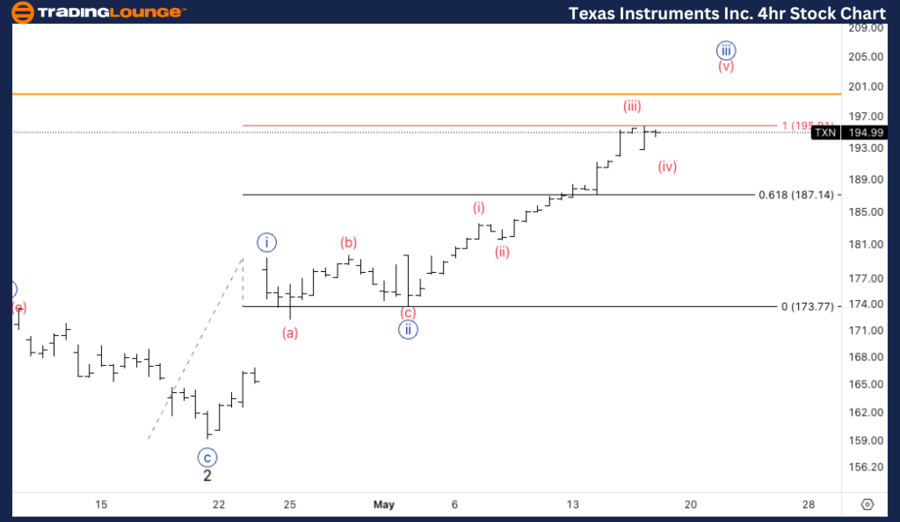
TXN Elliott Wave Analysis Trading Lounge 4Hr Chart,

TXN Elliott Wave Technical Analysis - 4-Hour Chart Analysis

FUNCTION: Trend

MODE: Impulsive

STRUCTURE: Motive

POSITION: Minute (iii) of {iii}.

DIRECTION: Upside in {iii}.

DETAILS: On the 4-hour chart, TXN continues its impulsive trend, currently in minute wave (iii) of {iii}. The analysis indicates an upward movement towards wave (v) of {iii}. We have reached the point of equality between waves {iii} and {i}, and we are now looking for this equality to establish a support level.

In the 4-hour chart, TXN is progressing within wave (v) of {iii}. Currently, the stock is at the equality level of wave {iii} vs. wave {i}. We are looking for this equality to turn into a support level, which would further confirm the bullish trend.

Texas-Instruments-In...

Related

S&P BSE Sensex Elliott Wave Analysis – Market Trends, Corrective Phase, and Trading Signals for Daily & Weekly Charts

S&P BSE Sensex Elliott Wave Analysis – Market Trends, Corrective Phase, and Trading Signals for Daily & Weekly Charts

S&P BSE Sensex (India) Index provides insights into the current corrective phase and upcoming bullis...

Read More >
 NIKKEI 225 Elliott Wave Techniacl Analysis: Bullish Trends, Key Wave Levels, and Technical Chart Insights

NIKKEI 225 Elliott Wave Techniacl Analysis: Bullish Trends, Key Wave Levels, and Technical Chart Insights

The NIKKEI 225 index exhibits a robust bullish trend, analyzed through Elliott Wave principles. Both...

Read More >
Improve your Investment Decisions with Expert Tips and Forecasts: IBEX 35 (Spain) Index Elliott Wave Technical Analysis

Improve your Investment Decisions with Expert Tips and Forecasts: IBEX 35 (Spain) Index Elliott Wave Technical Analysis

Our comprehensive guide on IBEX 35 trading and investing offers detailed Elliott Wave analysis and t...

Read More >
Unlocking ASX Trading Success: NATIONAL AUSTRALIA BANK LIMITED - NAB Stock Analysis & Elliott Wave Technical Forecast

Unlocking ASX Trading Success: NATIONAL AUSTRALIA BANK LIMITED - NAB Stock Analysis & Elliott Wave Technical Forecast

This article provides a detailed Elliott Wave analysis of National Australia Bank Limited (NAB) on t...

Read More >
Australian Dollar/U.S. Dollar (AUDUSD) Elliott Wave Analysis: Forecast Trends and Market Outlook for Forex Traders

Australian Dollar/U.S. Dollar (AUDUSD) Elliott Wave Analysis: Forecast Trends and Market Outlook for Forex Traders

AUDUSD Elliott Wave analysis provides a detailed outlook on market trends, including wave counts, tr...

Read More >
BTCUSD Elliott Wave Technical Analysis: Bitcoin/ U.S. Dollar Price Prediction, Trading Strategy and Key Insights

BTCUSD Elliott Wave Technical Analysis: Bitcoin/ U.S. Dollar Price Prediction, Trading Strategy and Key Insights

Gain a deeper understanding of Bitcoin's market movements with our BTCUSD Elliott Wave analysis....

Read More >

Buy 1 Month

Get 3 Months!

Special Offer:

Trade Recommendations

Unleash the power of deversified trading with our comprehensive portfolio, covering:

  • Stock Trades
  • Crypto Trades
  • Forex Trades
  • Commodity Trades
Elliott Wave Analysis

Gain a competive edge with expert insights in to:

  • Global Indices
  • US Stocks & ASX Stocks
  • Forex & Crypto
  • Commodities
Top-Notch Trading Tools

Equip yourself with the tools of success:

  • Social Chat
  • Elliott Wave Algorithm
  • Screener
  • TradingLevels
  • Trading Game
7 Elliott Wave Analysts

Stay ahead of the market with daily charts and insightful videos
-Your secret to strategic trading!

JOIN HERE


Welcome to TradingLounge (ASIC A.R.No. 321187), specialists in trades, trading education and technical analysis, covering stocks, indices, commodities, forex and cryptocurrencies.

When you join TradingLounge you have access to everything we offer, including trade tools, educational content and a social platform to chat with like-minded investors.

Read more

@Copyright 2024 by tradinglounge.com

Contact Us

Australian no: 02 4787 6020

International no: +61 (2) 47876020

Pay with:

Find us on