04Feb

WTI Crudeoil Oil Commodity Elliott Wave Technical Analysis Explores Oil Price predictions, Technical Patterns, and Market Trends

WTI Crudeoil Oil Elliott Wave Technical Analysis

WTI crude oil has completed its bullish correction from September 2024 and is now turning lower after facing resistance at a key Fibonacci zone. The decline from the January 15, 2025 top is expected to extend further, continuing both the short-term bearish cycle from July 2024 and the larger bearish trend that began in March 2022.

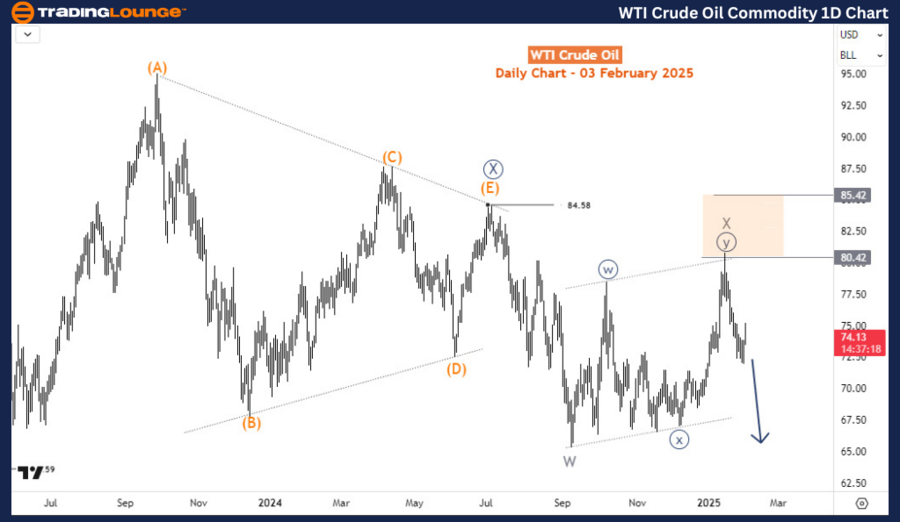
WTI Crudeoil Oil Commodity Daily Chart Analysis

The long-term price action is correcting the 5-wave impulse rally that followed the COVID-19 crude oil collapse. On March 7, 2022, WTI crude peaked at nearly $131, marking the top of this impulse wave advance. According to Elliott Wave Theory, a 3-wave correction follows a 5-wave trend.

This bearish correction has developed as a double zigzag pattern and remains incomplete. Thus, further downside pressure is expected in the medium to long term. Wave ((W)) ended in May 2023, followed by a 14-month sideways triangle formation for wave ((X)), which concluded in July 2024 at $84.5. As seen on the daily chart, wave ((Y)) began from the July 2024 high.

Wave (W) of ((Y)) is anticipated to push lower, with waves W and X of ((Y)) already completed. Currently, wave Y is evolving downward, indicating further bearish momentum.

WTI-Crudeoil-Oil-Com...


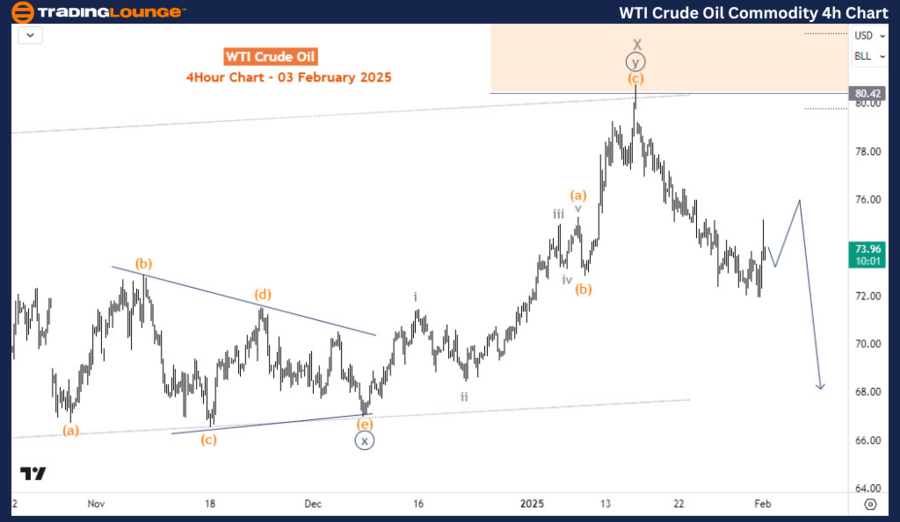
WTI Crudeoil Oil Commodity H4 Chart Analysis

On the H4 timeframe, the sub-waves of wave X are clearly visible, while the decline from wave X has either completed or is close to completing a 5-wave downtrend, potentially marking wave ((a)) of Y. From wave ((b)) of Y, sellers are expected to find fresh opportunities as long as WTI remains below the January 2025 top, where wave X was finalized.

Technical Analyst: Sanmi Adeagbo

Source: visit Tradinglounge.com and learn From the Experts Join TradingLounge Here 

See Previous: Gold (XAUUSD) Elliott Wave Technical Analysis

VALUE Offer - Buy 1 Month & Get 3 Months!Click here

Access 7 Analysts Over 200 Markets Covered. Chat Room With Support

WTI-Crudeoil-Oil-Com...


Key Takeaways:

  • WTI crude oil is reversing lower after completing its bullish correction from September 2024.
  • The long-term Elliott Wave structure suggests an incomplete double zigzag correction.
  • Wave ((Y)) started in July 2024, with wave Y evolving downward.
  • Short-term bearish momentum continues as long as prices remain below the January 2025 high.

This Elliott Wave forecast for WTI crude oil suggests that the market is favoring further declines in the coming weeks, making it crucial for traders to monitor key resistance levels.

Related

Master the Euro/U.S. Dollar Forex Market: Advanced EURUSD Elliott Wave Technical Analysis for Precision Trading on Day and 4-Hour Charts

Master the Euro/U.S. Dollar Forex Market: Advanced EURUSD Elliott Wave Technical Analysis for Precision Trading on Day and 4-Hour Charts

Gain a thorough understanding of the EURUSD market with our detailed Elliott Wave analysis. This art...

Read More >
Silver Price Forecast: Elliott Wave Analysis Predicts Strong Wave 3 Breakout After Completing Wave 2 Correction Above $28

Silver Price Forecast: Elliott Wave Analysis Predicts Strong Wave 3 Breakout After Completing Wave 2 Correction Above $28

Silver remains in a bullish uptrend, currently correcting before an expected wave 3 breakout above 2...

Read More >
Technical Analysis of Adani Green Energy Stock with Elliott Wave Insights: Understand Share Price and Trends Movements

Technical Analysis of Adani Green Energy Stock with Elliott Wave Insights: Understand Share Price and Trends Movements

Dive into the technical analysis of Adani Green Energy stock with Elliott Wave insights. Understand ...

Read More >
GRASIM Industries Bullish Elliott Wave 3 Forecast: Indian Stock Technical Chart Setup with Key Support and Strong Uptrend Signal

GRASIM Industries Bullish Elliott Wave 3 Forecast: Indian Stock Technical Chart Setup with Key Support and Strong Uptrend Signal

GRASIM Industries shows a bullish Elliott Wave structure with wave 3 now active, suggesting strong u...

Read More >
V300AEQ ETF UNITS – VAS Stock Analysis & Vanguard Elliott Wave Technical Forecast

V300AEQ ETF UNITS – VAS Stock Analysis & Vanguard Elliott Wave Technical Forecast

Our latest Elliott Wave analysis on ASX: V300AEQ ETF Units – VAS reveals that wave 2-red has conclu...

Read More >

$1 for 2 Weeks

then $29 a month!

What a Special Offer!

Trade Recommendations

Unleash the power of deversified trading with our comprehensive portfolio, covering 250+ markets:

  • Stock Trades
  • Crypto Trades
  • Forex Trades
  • Commodity Trades
Elliott Wave Analysis

Gain a competitive edge with expert insights and AI-powered Elliott Wave charting into:

  • Global Indices
  • US Stocks & ASX Stocks
  • Forex & Crypto
  • Commodities
Top-Notch Trading Tools

Equip yourself with the tools of success:

  • Real-time Chat rooms
  • Elliott Wave Algorithm
  • Portfolio tools
  • TradingLevels
  • Screener
  • Trading Game
7 Elliott Wave Analysts

Stay ahead of the market with daily charts and insightful videos
Your secret to strategic trading!

JOIN HERE


Welcome to TradingLounge (ASIC A.R.No. 321187), specialists in trades, trading education and technical analysis, covering stocks, indices, commodities, forex and cryptocurrencies.

When you join TradingLounge you have access to everything we offer, including trade tools, educational content and a social platform to chat with like-minded investors.

Read more

@Copyright 2024 by tradinglounge.com

Contact Us

Australian no: 02 4787 6020

International no: +61 (2) 47876020

Pay with:

Find us on