09Jan

NEE Elliott Wave Analysis: Explore NextEra Energy Stock Trends, Flat Structures, and Bullish Reversal Forecasts

This Elliott Wave analysis of NextEra Energy Inc. (NEE) provides insights into the daily and 1-hour charts. It highlights the corrective patterns and the potential for bullish reversals, offering valuable trading insights.

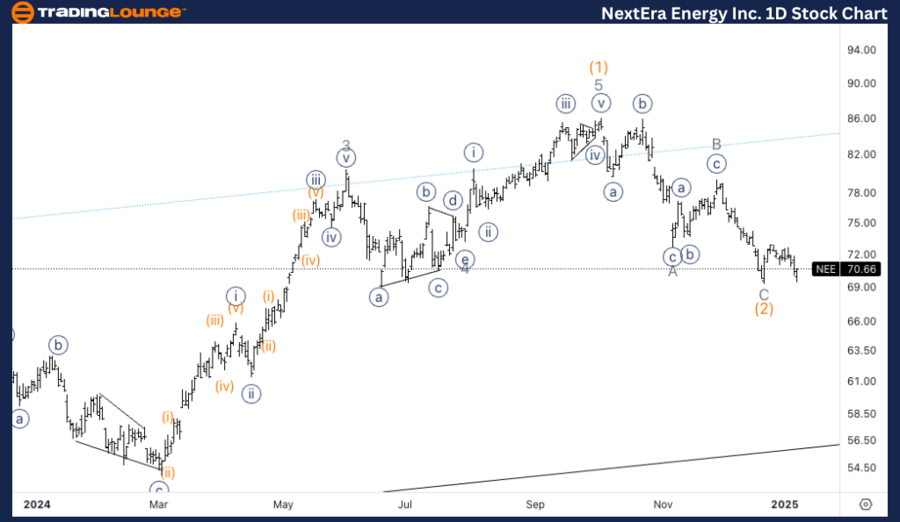
NextEra Energy Inc., (NEE) Elliott Wave Analysis - Trading Lounge Daily Chart

NEE Elliott Wave Technical Analysis

Function: Counter Trend

Mode: Corrective

Structure: Flat

Position: Wave C of (2)

Direction: Bottom in Wave C

Details

NextEra Energy Inc. (NEE) appears to be approaching a potential wave C of (2) bottom. The price action has entered the area of the previous wave 4, a common target zone for wave C corrections of the same degree. A reversal or confirmation of the wave C bottom could signal the conclusion of the (2) correction phase, potentially setting the stage for the next impulsive upward movement.

Key Observations:

  • Price currently testing the previous wave 4 region.
  • Possible reversal to indicate the start of an impulsive wave.
  • Monitor closely for confirmation of bottom formation.

NextEra-Energy-Inc-1...


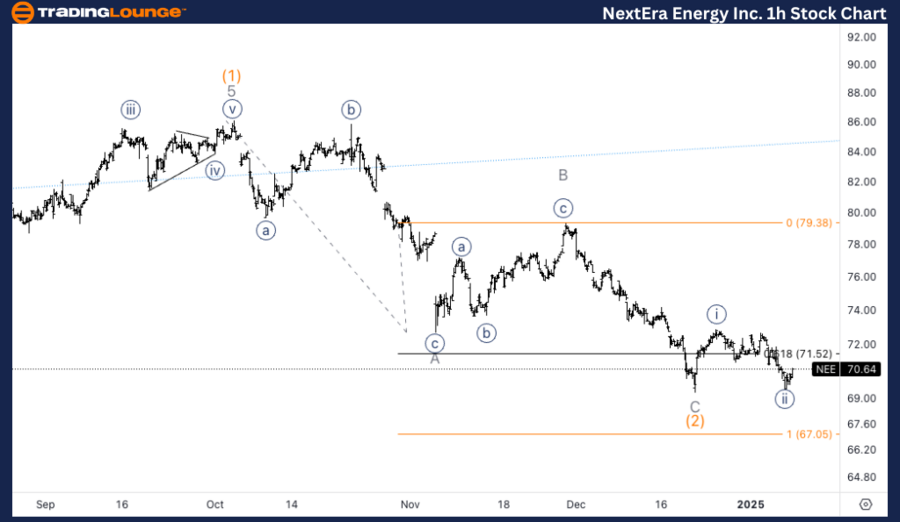
NextEra Energy Inc., (NEE) Elliott Wave Analysis - Trading Lounge 1H Chart

NEE Elliott Wave Technical Analysis

Function: Counter Trend

Mode: Corrective

Structure: Flat

Position: Wave C of (2)

Direction: Bottom in Wave C

Details

On the 1-hour chart, NEE is showing the potential for the completion of wave C and the initial stages of wave {i} and {ii}. However, caution is necessary as the price is close to an invalidation level. A break above key resistance levels would confirm the end of wave C, signaling the beginning of a bullish reversal.

Key Observations:

  • Watching for early signs of wave {i} and {ii} formation.

  • Close proximity to invalidation level requires careful monitoring.
  • Upside confirmation needed to validate the next wave progression.

Technical Analyst: Alessio Barretta

Source: visit Tradinglounge.com and learn From the Experts Join TradingLounge Here 

See Previous: Salesforce Inc. (CRM) Elliott Wave Technical Analysis

VALUE Offer - Buy 1 Month & Get 3 Months!Click here

Access 7 Analysts Over 200 Markets Covered. Chat Room With Support

NextEra-Energy-Inc-1...

Related

Alphabet Inc. (GOOGL) Elliott Wave Analysis: Stock Forecast, Price Trends, and Investment Strategies for Better Trading Decisions

Alphabet Inc. (GOOGL) Elliott Wave Analysis: Stock Forecast, Price Trends, and Investment Strategies for Better Trading Decisions

Elliott Wave analysis of Alphabet Inc. (GOOGL), highlighting stock forecasts, potential resistance l...

Read More >
Visa Inc. (V) Stock Elliott Wave Analysis: Bullish Trend Insights, Price Forecasts, Wave 5 Targets, and Key Support

Visa Inc. (V) Stock Elliott Wave Analysis: Bullish Trend Insights, Price Forecasts, Wave 5 Targets, and Key Support

Visa Inc. stock is currently navigating through Elliott Wave patterns, with Wave {ii} of 5 showing b...

Read More >
Historic Coffee Price Breakout Expected: Elliott Wave Analysis Reveals $385 Target and Unprecedented Market Opportunities for Traders

Historic Coffee Price Breakout Expected: Elliott Wave Analysis Reveals $385 Target and Unprecedented Market Opportunities for Traders

Coffee prices are gaining momentum, with a potential breakout to record highs predicted by Elliott w...

Read More >
U.S.Dollar/Swiss Franc (USD/CHF) Elliott Wave Technical Analysis Trading Lounge: In-Depth Technical Insights

U.S.Dollar/Swiss Franc (USD/CHF) Elliott Wave Technical Analysis Trading Lounge: In-Depth Technical Insights

Our USD/CHF Elliott Wave Analysis provides traders with valuable insights into the current market dy...

Read More >
BTCUSD Elliott Wave Analysis: Bitcoin Price Prediction, Key Support at 78,402 USD, Potential V Wave Formation, and 126K USD Target

BTCUSD Elliott Wave Analysis: Bitcoin Price Prediction, Key Support at 78,402 USD, Potential V Wave Formation, and 126K USD Target

BTCUSD has corrected to a critical support level at 78,402 USD, where buyers have stepped in. Based ...

Read More >
Comprehensive Australian Dollar/U.S.Dollar (AUDUSD) Elliott Wave Technical Analysis for strategic trading decisions

Comprehensive Australian Dollar/U.S.Dollar (AUDUSD) Elliott Wave Technical Analysis for strategic trading decisions

Explore detailed Elliott Wave Technical analysis for AUDUSD on both daily and 4-hour charts dated F...

Read More >

Buy 1 Month

Get 3 Months!

Special Offer:

Trade Recommendations

Unleash the power of deversified trading with our comprehensive portfolio, covering:

  • Stock Trades
  • Crypto Trades
  • Forex Trades
  • Commodity Trades
Elliott Wave Analysis

Gain a competive edge with expert insights in to:

  • Global Indices
  • US Stocks & ASX Stocks
  • Forex & Crypto
  • Commodities
Top-Notch Trading Tools

Equip yourself with the tools of success:

  • Social Chat
  • Elliott Wave Algorithm
  • Screener
  • TradingLevels
  • Trading Game
7 Elliott Wave Analysts

Stay ahead of the market with daily charts and insightful videos
-Your secret to strategic trading!

JOIN HERE


Welcome to TradingLounge (ASIC A.R.No. 321187), specialists in trades, trading education and technical analysis, covering stocks, indices, commodities, forex and cryptocurrencies.

When you join TradingLounge you have access to everything we offer, including trade tools, educational content and a social platform to chat with like-minded investors.

Read more

@Copyright 2024 by tradinglounge.com

Contact Us

Australian no: 02 4787 6020

International no: +61 (2) 47876020

Pay with:

Find us on