08Jan

Salesforce Inc. (CRM) Elliott Wave Analysis: Salesforce Stock Trends, Bullish Forecasts, and Technical Insights for Smarter Trading

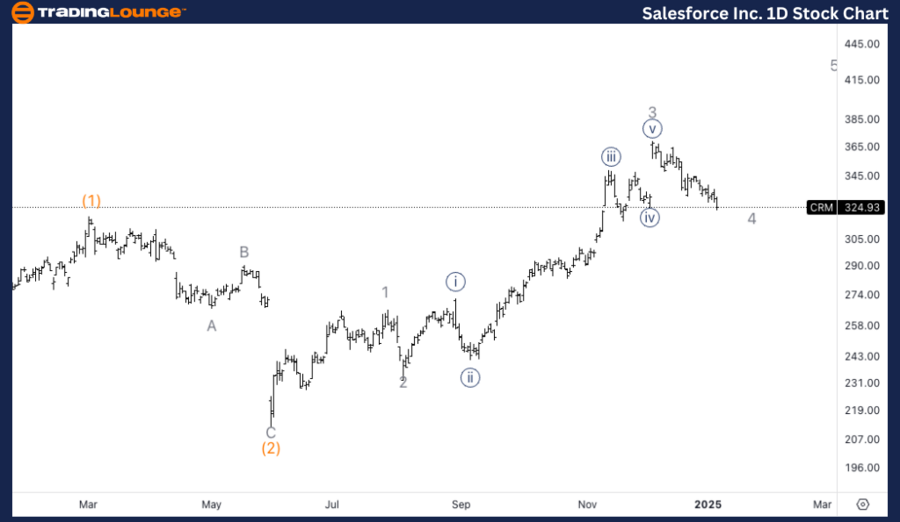
Salesforce Inc. (CRM) Elliott Wave Analysis - Trading Lounge Daily Chart

CRM Elliott Wave Technical Analysis

Function: Counter Trend

Mode: Corrective

Structure: Complex

Position: Wave 4 of (3)

Direction: Pullback in Wave 4

Details:

Salesforce Inc. is currently experiencing a potential Wave 4 correction, which seems to be nearing completion. However, it remains uncertain whether this is Wave 4 of (3) or if the stock has transitioned into Wave 1 of (3), indicating greater upside potential. Confirmation of the wave structure will be crucial to determine the next directional move. For now, traders should monitor the completion of the Wave 4 pullback to assess whether it will lead to a continuation in the uptrend (Wave (3)) or lay the foundation for a broader bullish breakout.

CRM Elliott Wave Technical Analysis – Daily Chart

Salesforce's Wave 4 corrective pullback appears close to completion on the daily chart. The current wave structure presents two possibilities: either the correction concludes Wave 4 of (3), continuing the uptrend, or it represents the early stages of Wave 1 of (3), signaling substantial bullish potential ahead. Until wave confirmation is observed, traders should prepare for an imminent resolution of the correction.

Salesforce-Inc-1d-st...


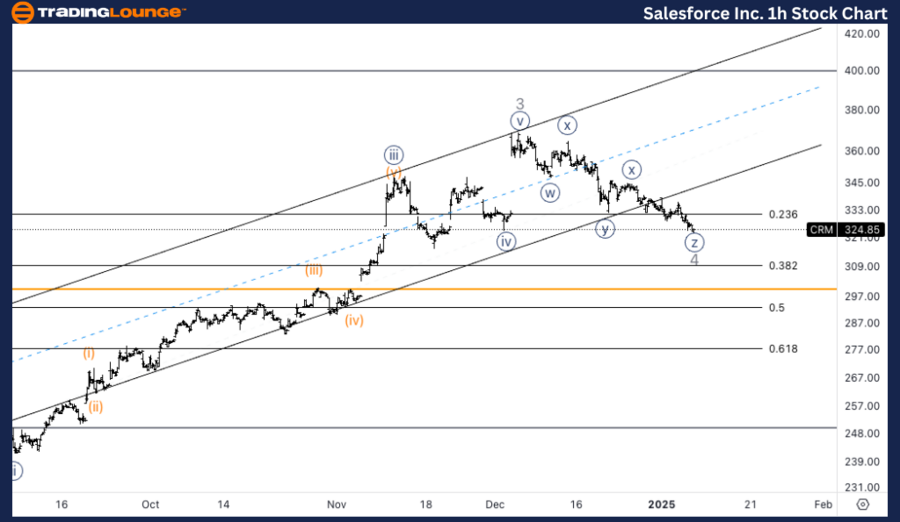
Salesforce Inc. (CRM) Elliott Wave Analysis - Trading Lounge 1-Hour Chart

CRM Elliott Wave Technical Analysis

Function: Counter Trend

Mode: Corrective

Structure: Complex

Position: Wave {z} of 4

Direction: Approaching Bottom in Wave 4

Details:

The 1-hour chart analysis indicates a Wave {z} of 4 correction, which is nearing its final stages. The price is approaching the typical correction zone near the previous Wave {iv}, where a bottom could form. A reversal or a pullback higher is expected in the short term, signaling the end of Wave 4 and the potential start of an upward trend.

CRM Elliott Wave Technical Analysis – 1-Hour Chart

The 1-hour timeframe suggests that Salesforce is in the last phase of its Wave {z} of 4 correction. As the price nears the region of the prior Wave {iv}, a bottom is anticipated soon. This corrective phase is likely to conclude with either a reversal or at least a higher pullback, marking the transition to a bullish movement. Traders should closely watch for confirmations signaling the completion of Wave 4 and the onset of an upward trend.

Technical Analyst: Alessio Barretta

Source: visit Tradinglounge.com and learn From the Experts Join TradingLounge Here 

See Previous: Netflix Inc. (NFLX) Elliott Wave Technical Analysis

VALUE Offer - Buy 1 Month & Get 3 Months!Click here

Access 7 Analysts Over 200 Markets Covered. Chat Room With Support

Salesforce-Inc-1h-st...

Related

Euro/U.S.Dollar (EURUSD) Elliott Wave Technical  Analysis: Trading Lounge Insights for the Day

Euro/U.S.Dollar (EURUSD) Elliott Wave Technical Analysis: Trading Lounge Insights for the Day

In our EURUSD Elliott Wave Analysis for March 5, 2024, we emphasize the impulsive and trending natur...

Read More >
Maximize Gains with Expert NASDAQ Elliott Wave Analysis and Trading Strategies

Maximize Gains with Expert NASDAQ Elliott Wave Analysis and Trading Strategies

Explore our expert Elliott Wave Analysis and trading strategies for NASDAQ 100 (NDX) and leading tec...

Read More >
Mastering Bitcoin Trading with Elliott Wave Analysis - Bitcoin/ U.S. dollar(BTCUSD) Technical Insights

Mastering Bitcoin Trading with Elliott Wave Analysis - Bitcoin/ U.S. dollar(BTCUSD) Technical Insights

Dive into the latest Bitcoin trading trends and Elliott Wave Technical Analysis for BTCUSD. Stay upd...

Read More >
Commodity Markets: BITCOIN, BONDS, YIELDS, DOLLAR, GOLD, SILVER, ORE, OIL, COPPER, GAS, Elliott Wave

Commodity Markets: BITCOIN, BONDS, YIELDS, DOLLAR, GOLD, SILVER, ORE, OIL, COPPER, GAS, Elliott Wave

The latest Elliott Wave Analysis for the commodity market suggests a positive trajectory for cryptoc...

Read More >
Invest in Hang Seng Stocks, Explore the Best Options, and Stay Informed: Hang Seng Index Elliott Wave Technical Analysis

Invest in Hang Seng Stocks, Explore the Best Options, and Stay Informed: Hang Seng Index Elliott Wave Technical Analysis

The Hang Seng Index is a pivotal focus for investors seeking to navigate the complexities of the Hon...

Read More >
BHARAT ELECTRONICS Share Price Forecast with Elliott Wave Analysis of BEL Daily and Weekly Charts for Future Stock Prediction

BHARAT ELECTRONICS Share Price Forecast with Elliott Wave Analysis of BEL Daily and Weekly Charts for Future Stock Prediction

BHARAT ELECTRONICS using Elliott Wave Theory, covering both daily and weekly charts. It outlines the...

Read More >

$1 for 2 Weeks

then $29 a month!

What a Special Offer!

Trade Recommendations

Unleash the power of deversified trading with our comprehensive portfolio, covering 250+ markets:

  • Stock Trades
  • Crypto Trades
  • Forex Trades
  • Commodity Trades
Elliott Wave Analysis

Gain a competitive edge with expert insights and AI-powered Elliott Wave charting into:

  • Global Indices
  • US Stocks & ASX Stocks
  • Forex & Crypto
  • Commodities
Top-Notch Trading Tools

Equip yourself with the tools of success:

  • Real-time Chat rooms
  • Elliott Wave Algorithm
  • Portfolio tools
  • TradingLevels
  • Screener
  • Trading Game
7 Elliott Wave Analysts

Stay ahead of the market with daily charts and insightful videos
Your secret to strategic trading!

JOIN HERE


Welcome to TradingLounge (ASIC A.R.No. 321187), specialists in trades, trading education and technical analysis, covering stocks, indices, commodities, forex and cryptocurrencies.

When you join TradingLounge you have access to everything we offer, including trade tools, educational content and a social platform to chat with like-minded investors.

Read more

@Copyright 2024 by tradinglounge.com

Contact Us

Australian no: 02 4787 6020

International no: +61 (2) 47876020

Pay with:

Find us on